Consolidated Financial Statements 2014
Consolidated Financial Statements 2014
of the Volksbanken Raiffeisenbanken Cooperative Financial Network
Income statement for the period January 1 to December 31, 2014
| Note no. | 2014 € million | 2013 € million | Change (percent) | |
|---|---|---|---|---|
| Net interest income | 2. | 20,047 | 20,010 | 0.2 |
| Interest income and current income and expense | 30,657 | 31,822 | –3.7 | |
| Interest expense | –10,610 | –11,812 | –10.2 | |
| Allowances for losses on loans and advances | 3. | –299 | –774 | –61.4 |
| Net fee and commission income | 4. | 5,467 | 5,061 | 8.0 |
| Fee and commission income | 6,793 | 6,530 | 4.0 | |
| Fee and commission expense | –1,326 | –1,469 | –9.7 | |
| Gains and losses on trading activities | 5. | 752 | 507 | 48.3 |
| Gains and losses on investments | 6. | 148 | –523 | >100.0 |
| Other gains and losses on valuation of financial instruments | 7. | 435 | 1,077 | –59.6 |
| Premiums earned | 8. | 13,927 | 12,693 | 9.7 |
| Gains and losses on investments held by insurance companies and other insurance company gains and losses | 9. | 4,388 | 2,816 | 55.8 |
| Insurance benefit payments | 10. | –15,264 | –13,181 | 15.8 |
| Insurance business operating expenses | 11. | –1,770 | –1,662 | 6.5 |
| Administrative expenses | 12. | –16,895 | –16,486 | 2.5 |
| Other net operating expense/income | 13. | –281 | 15 | >100.0 |
| Profit before taxes | 10,655 | 9,553 | 11.5 | |
| Income taxes | 14. | –2,848 | –2,691 | 5.8 |
| Net profit | 7,807 | 6,862 | 13.8 | |
Attributable to: | ||||
| Shareholders of the Cooperative Financial Network | 7,555 | 6,664 | 13.4 | |
| Non-controlling interests | 252 | 198 | 27.3 |
Statement of comprehensive income for the period January 1 to December 31, 2014
| 2014 € million | 2013 € million | Change (percent) | |
|---|---|---|---|
| Net profit | 7,807 | 6,862 | 13.8 |
| Other comprehensive income | –513 | 555 | >100.0 |
| Amounts reclassified to the income statement | 956 | 353 | >100.0 |
| Gains and losses on available-for-sale financial assets | 1,397 | 460 | >100.0 |
| Gains and losses on cash flow hedges | –31 | – | – |
| Exchange differences on currency translation of foreign operations | 12 | –10 | >100.0 |
| Gains and losses on hedges of net investments in foreign operations | –16 | 5 | >100.0 |
| Share of other comprehensive income/loss of joint ventures and associates accounted for using the equity method | 27 | –19 | >100.0 |
| Income taxes | –433 | –83 | >100.0 |
| Amounts not reclassified to the income statement | –1,469 | 202 | >100.0 |
| Gains and losses arising from remeasurements of defined benefit plans | –2,092 | 365 | >100.0 |
| Share of other comprehensive income/loss of joint ventures and associates accounted for using the equity method | –4 | –1 | >100.0 |
| Income taxes | 627 | –162 | >100.0 |
| Total comprehensive income | 7,294 | 7,417 | –1.7 |
Attributable to: | |||
| Shareholders of the Cooperative Financial Network | 6,950 | 7,173 | –3.1 |
| Non-controlling interests | 344 | 244 | 41.0 |
Balance sheet as at December 31, 2014
| Assets | Note no. | Dec. 31, 2014 € million | Dec. 31, 2013 € million | Change (percent) |
|---|---|---|---|---|
| Cash and cash equivalents | 15. | 15,656 | 15,980 | –2.0 |
| Loans and advances to banks | 16. | 38,293 | 33,413 | 14.6 |
| Loans and advances to customers | 16. | 670,683 | 648,470 | 3.4 |
| Allowances for losses on loans and advances | 17. | –8,519 | –9,284 | –8.2 |
| Derivatives used for hedging (positive fair values) | 18. | 1,099 | 1,382 | –20.5 |
| Financial assets held for trading | 19. | 61,181 | 57,539 | 6.3 |
| Investments | 20. | 249,219 | 237,257 | 5.0 |
| Investments held by insurance companies | 21. | 77,545 | 67,868 | 14.3 |
| Property, plant and equipment, and investment property | 22. | 11,429 | 10,668 | 7.1 |
| Income tax assets | 23. | 4,484 | 4,907 | –8.6 |
| Other assets | 24. | 14,690 | 12,365 | 18.8 |
| Total assets | 1,135,760 | 1,080,565 | 5.1 |
| Equity and liabilities | Note no. | Dec. 31, 2014 € million | Dec. 31, 2013 € million | Change (percent) |
|---|---|---|---|---|
| Deposits from banks | 25. | 103,526 | 96,210 | 7.6 |
| Deposits from customers | 25. | 713,485 | 693,191 | 2.9 |
| Debt certificates issued including bonds | 26. | 66,981 | 67,507 | –0.8 |
| Derivatives used for hedging (negative fair values) | 18. | 10,423 | 7,178 | 45.2 |
| Financial liabilities held for trading | 27. | 52,760 | 44,310 | 19.1 |
| Provisions | 28. | 13,661 | 11,356 | 20.3 |
| Insurance liabilities | 29. | 74,670 | 67,386 | 10.8 |
| Income tax liabilities | 23. | 1,198 | 1,001 | 19.7 |
| Other liabilities | 30. | 7,819 | 7,621 | 2.6 |
| Subordinated capital | 31. | 4,736 | 5,419 | –12.6 |
| Equity | 86,501 | 79,386 | 9.0 | |
| Subscribed capital | 10,762 | 10,424 | 3.2 | |
| Capital reserves | 754 | 708 | 6.5 | |
| Retained earnings | 62,807 | 58,019 | 8.3 | |
| Revaluation reserve | 1,258 | 435 | >100.0 | |
| Cash flow hedge reserve | –15 | 4 | >100.0 | |
| Currency translation reserve | 32 | 12 | >100.0 | |
| Non-controlling interests | 3,348 | 3,120 | 7.3 | |
| Unappropriated earnings | 7,555 | 6,664 | 13.4 | |
| Total equity and liabilities | 1,135,760 | 1,080,565 | 5.1 |
Statement of changes in equity
€ million
| Subscribed capital | Capital reserves | Equity earned by the Cooperative Financial Network | Revaluation reserve | Cash flow hedge reserve | Currency translation reserve | Equity before non-controlling interests | Non-controlling interests | Total equity | |
|---|---|---|---|---|---|---|---|---|---|
| Equity as at Jan. 1, 2013 | 9,994 | 703 | 58,414 | 104 | 4 | 36 | 69,255 | 2,943 | 72,198 |
| Net profit | – | – | 6,664 | – | – | – | 6,664 | 198 | 6,862 |
| Other comprehensive income/loss | – | – | 201 | 332 | – | –24 | 509 | 46 | 555 |
| Total comprehensive income/loss | – | – | 6,865 | 332 | – | –24 | 7,173 | 244 | 7,417 |
| Issue and repayment of equity | 430 | 5 | – | – | – | – | 435 | –8 | 427 |
| Changes in the scope of consolidations | – | – | –14 | – | – | – | –14 | –3 | –17 |
| Acquisition/disposal of non-controlling interests | – | – | –62 | –1 | – | – | –63 | –2 | –65 |
| Dividends paid | – | – | –520 | – | – | – | –520 | –54 | –574 |
| Equity as at Dec. 31, 2013 | 10,424 | 708 | 64,683 | 435 | 4 | 12 | 76,266 | 3,120 | 79,386 |
| Net profit | – | – | 7,555 | – | – | – | 7,555 | 252 | 7,807 |
| Other comprehensive income/loss | – | – | –1,441 | 835 | –19 | 20 | –605 | 92 | –513 |
| Total comprehensive income | – | – | 6,114 | 835 | –19 | 20 | 6,950 | 344 | 7,294 |
| Issue and repayment of equity | 338 | 46 | – | – | – | – | 384 | 144 | 528 |
| Changes in the scope of consolidation | – | – | 46 | –12 | – | – | 34 | 1 | 35 |
| Acquisition/disposal of non-controlling interests | – | – | 101 | – | – | – | 101 | –198 | –97 |
| Dividends paid | – | – | –582 | – | – | – | –582 | –63 | –645 |
| Equity as at Dec. 31, 2014 | 10,762 | 754 | 70,362 | 1,258 | –15 | 32 | 83,153 | 3,348 | 86,501 |
| The table below gives a breakdown of subscribed capital: | Dec. 31, 2014 € million | Dec. 31, 2013 € million | Change (percent) |
|---|---|---|---|
| Cooperative shares | 10,271 | 9,768 | 5.1 |
| Share capital | 176 | 176 | – |
| Capital of silent partners | 315 | 480 | –34.4 |
| Total | 10,762 | 10,424 | 3.2 |
Statement of cash flows
| 2014 € million | 2013 € million | |
|---|---|---|
| Net profit | 7,807 | 6,862 |
| Non-cash items included in net profit and reconciliation to cash flows from operating activities | ||
| Depreciation, amortization, impairment losses, and reversals of impairment losses on assets, and other non-cash changes in financial assets and liabilities | –1,676 | 203 |
| Non-cash changes in provisions | 2,305 | –452 |
| Changes in insurance liabilities | 9,977 | 3,709 |
| Other non-cash income and expenses | 981 | 1,069 |
| Gains and losses on the disposal of assets and liabilities | –152 | 495 |
| Other adjustments (net) | –18,746 | –19,502 |
| Subtotal | 496 | –7,616 |
| Cash changes in assets and liabilities arising from operating activities | ||
| Loans and advances to banks and customers | –27,134 | –9,959 |
| Other assets from operating activities | 1,075 | 720 |
| Derivatives used for hedging (positive and negative fair values) | 434 | –681 |
| Financial assets and financial liabilities held for trading | 4,812 | 803 |
| Deposits from bank and from customers | 26,543 | 14,547 |
| Debt certificates issued including bonds | –909 | –15,596 |
| Other liabilities from operating activities | –2,676 | 465 |
| Interest, dividends and operating lease payments received | 29,063 | 32,538 |
| Interest paid | –8,333 | –11,912 |
| Income taxes paid | –2,314 | –1,742 |
| Cash flows from operating activities | 21,057 | 1,567 |
The consolidated statement of cash flows shows the changes in cash and cash equivalents during the financial year. Cash and cash equivalents consist of cash on hand, balances with central banks and other government institutions as well as treasury bills and non-interest bearing treasury notes. The cash reserve does not include any financial investments with a maturity of more than three months at the date of acquisition. Changes in cash and cash equivalents are broken down into operating, investing and financing activities.
| 2014 € million | 2013 € million | |
|---|---|---|
| Proceeds from the sale of investments | 13,551 | 32,468 |
| Proceeds from the sale of investments held by insurance companies | 24,670 | 27,250 |
| Payments for acquisitions of investments | –23,490 | –27,658 |
| Payments for acquisitions of investments held by insurance companies | –32,110 | –30,799 |
| Net payments for acquisitions of property, plant and equipment, and investment property (excluding assets subject to operating leases) | –1,144 | –558 |
| Changes in the scope of consolidation | –21 | 28 |
| Net change in cash and cash equivalents from other investing activities | 18 | 58 |
| Cash flow from investing activities | –18,526 | 789 |
| Proceeds from capital increases | 528 | 435 |
| Dividends paid to shareholders of the Cooperative Financial Network and non-controlling interests | –645 | –574 |
| Other payments to shareholders of the Cooperative Financial Network and non-controlling interests | – | –8 |
| Net change in cash and cash equivalents from other financing activities (including subordinated capital) | –2,738 | –506 |
| Cash flows from financing activities | –2,855 | –653 |
| Cash and cash equivalents as at January 1 | 15,980 | 14,277 |
| Cash flows from operating activities | 21,057 | 1,567 |
| Cash flows from investing activities | –18,526 | 789 |
| Cash flows from financing activities | –2,855 | –653 |
| Cash and cash equivalents as at December 31 | 15,656 | 15,980 |
Cash flows from operating activities comprise cash flows mainly arising in connection with the revenue generating activities of the Cooperative Financial Network or other activities that cannot be classified as investing or financing activities. Cash flows related to the acquisition and sale of non-current assets are allocated to investing activities. Cash flows from financing activities include cash flows arising from transactions with equity owners and from other borrowings to finance business activities.
Notes to the consolidated financial statements
A Significant financial reporting principles
Basis of preparation of the consolidated financial statements
The consolidated financial statements of the Volksbanken Raiffeisenbanken Cooperative Financial Network prepared by the Federal Association of German Cooperative Banks (BVR) are based on the regulations applicable to publicly traded companies in the European Union (EU). The BVR is under no legal obligation to prepare such consolidated financial statements. The cooperative shares and share capital of the local cooperative banks are held by their members. The local cooperative banks own the share capital of the central institutions either directly or through intermediate holding companies. The Cooperative Financial Network does not qualify as a corporate group as defined by the International Financial Reporting Standards (IFRS), the German Commercial Code (HGB) or the German Stock Corporation Act (AktG).
These consolidated financial statements have been prepared solely for informational purposes and to present the business development and performance of the Cooperative Financial Network, which is treated as a single economic entity in terms of its risks and strategies. These consolidated financial statements are not a substitute for analysis of the consolidated entities' financial statements.
The accounting policies applied in these consolidated financial statements are generally based on the International Financial Reporting Standards (IFRS).
The underlying data presented in these consolidated financial statements is provided by the separate and consolidated financial statements of the entities in the Cooperative Financial Network and also includes data from supplementary surveys of the local cooperative banks. The consolidated financial statements of DZ BANK and of WGZ BANK included in these consolidated financial statements have been prepared on the basis of IFRS as adopted by the European Union.
As part of the preparation of these consolidated financial statements, the financial statements of the local cooperative banks and of the BVR protection scheme that are included and have been prepared in accordance with the German Commercial Code have been brought into line with IFRSs. Thus, using a simplified approach, assets, liabilities, equity, income and expenses are reconciled to the carrying amounts that would have resulted from consistent application of IFRS.
As in the previous years, certain assumptions and simplifications have been used to prepare these consolidated financial statements. These assumptions and simplifications have been made using tried-and-tested methods and have been properly verified. These assumptions and simplifications have been used to eliminate intranetwork balances, transactions, income and expenses in a way that reflects the unique structure of the Cooperative Financial Network.
The financial year corresponds to the calendar year. In the interest of clarity, some items on the face of the balance sheet and the income statement have been aggregated and are explained by additional disclosures. Unless stated otherwise, all amounts are shown in millions of euros (€ million). All figures are rounded to the nearest whole number. This may result in very small discrepancies in the calculation of totals and percentages in these consolidated financial statements.
Scope of consolidation
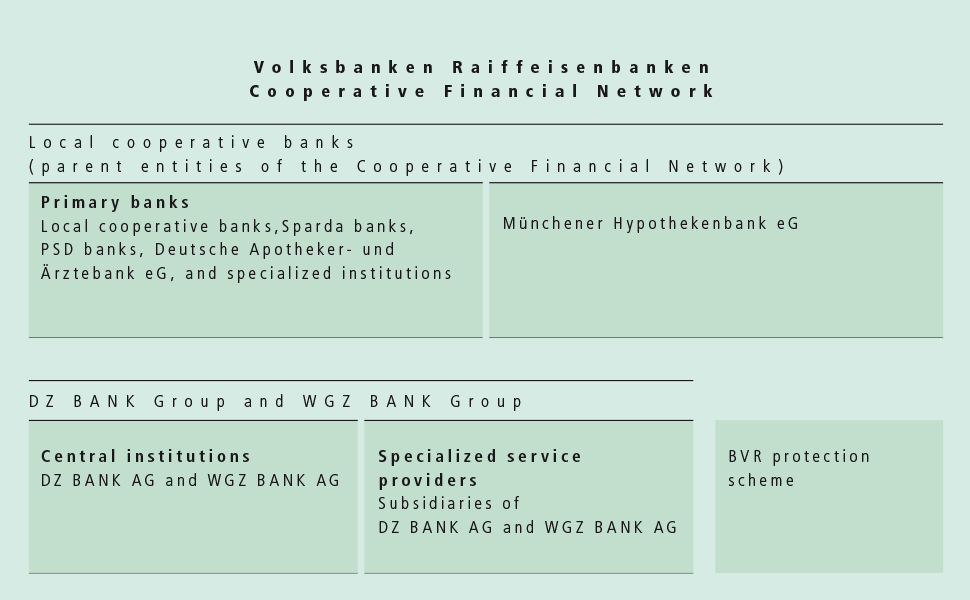
The consolidated entities included in these consolidated financial statements are 1,036 primary banks (2013: 1,074), the DZ BANK Group, the WGZ BANK Group, Münchener Hypothekenbank eG (MHB), and the BVR protection scheme. The consolidated primary banks include Deutsche Apotheker und Ärztebank eG, the Sparda banks, the PSD banks, and specialized institutions such as BAG Bankaktiengesellschaft.
The primary banks and MHB are the legally independent, horizontally structured parent entities of the Cooperative Financial Network, whereas the other corporate groups and entities are consolidated as subsidiaries. The two cooperative central institutions and a total of 622 subsidiaries (2013: 779) have been consolidated in the DZ BANK Group and WGZ BANK Group.
The consolidated financial statements include 23 joint ventures between a consolidated entity and at least one other non-network entity (2013: 22) and 25 associates (2013: 19) over which a consolidated entity has significant influence, that are accounted for using the equity method.
Due to the fact that IFRS 10 was required to be applied for the first time for the financial year under review, there were changes in the scope of consolidation resulting from the DZ BANK Group. Since the effects of the changes on the consolidated financial statements are immaterial, we elected not to adjust prior-year figures.
Procedures of consolidation
Similar to IFRS 3 in conjunction with IFRS 10, business combinations are accounted for using the purchase method by offsetting the acquisition cost of a subsidiary against the share of the equity that is attributable to the parent entities and remeasured at fair value on the relevant date when control is acquired. This eliminates the multiple gearing of eligible own funds and any inappropriate creation of own funds for regulatory purposes between the consolidated entities listed above. Any positive difference is recognized as goodwill under other assets and is subject to an annual impairment test. Any negative goodwill is recognized immediately in profit or loss. Any share of subsidiaries' net assets not attributable to the parent entities is reported as non-controlling interests within equity.
Investments in joint ventures and in associates are accounted for using the equity method and reported under investments.
The consolidated subsidiaries have generally prepared their financial statements on the basis of the financial year ended December 31, 2014. There is one subsidiary (2013: 1 subsidiary) included in the consolidated financial statements with a different reporting date for its annual financial statements. With 20 exceptions (2013: 16 exceptions), the separate financial statements of the entities accounted for using the equity method are prepared to the same balance sheet date as that of the consolidated financial statements.
Assets and liabilities as well as income and expenses arising within the Cooperative Financial Network are offset against each other on the basis of certain assumptions and simplifications. Gains and losses arising from transactions between entities within the Cooperative Financial Network are eliminated.
Financial instruments
Financial instruments within the scope of IAS 39 are designated upon initial recognition to the categories defined in IAS 39 on the basis of their characteristics and intended use. IAS 39 defines the following categories:
Financial instruments at fair value through profit or loss
Financial instruments in this category are recognized at fair value through profit or loss. This category is broken down into the following subcategories.
Financial instruments held for trading
The “financial instruments held for trading“ subcategory covers financial assets and financial liabilities that are acquired or incurred for the purpose of selling or repurchasing them in the near term, that are part of a portfolio of identified financial instruments that are managed together and for which there is evidence of a recent actual pattern of short-term profit-taking, or that are derivatives, except for derivatives that are designated as effective hedging instruments.
Contingent consideration in a business combination
This subcategory includes contingent considerations classified by the acquirer in a business combination as financial assets or financial liabilities.
Financial instruments designated as at fair value through profit or loss; fair value option
Financial assets and financial liabilities may be designated to the "financial instruments designated as at fair value through profit or loss" subcategory by exercising the fair value option, provided that the application of this option eliminates or significantly reduces a measurement or recognition inconsistency (accounting mismatch), the financial assets and liabilities are managed as a portfolio on a fair value basis or they include one or more embedded derivatives required to be separated from the host contract.
Held-to-maturity investments
The “held-to-maturity investments“ category consists of non-derivative financial assets with fixed or determinable payments and fixed maturity that an entity has the positive intention and ability to hold to maturity. These investments are measured at amortized cost.
Loans and receivables
The “loans and receivables“ category comprises non-derivative financial assets with fixed or determinable payments that are not quoted in an active market. Loans and receivables are measured at amortized cost.
Available-for-sale financial assets
“Available-for-sale financial assets“ are financial assets that cannot be classified in any other category. In principle, they are measured at fair value. Any changes in fair value occurring between 2 reporting dates are recognized in other comprehensive income. The fair value changes are reported in equity under the “revaluation reserve“. If financial assets included in this category are sold, gains and losses recognized in the revaluation reserve are reclassified to the income statement.
Financial liabilities measured at amortized cost
This category mainly includes all financial liabilities within the scope of IAS 39 that are not held for trading or classified as liabilities measured at fair value through profit or loss.
Other financial instruments
Separate regulations apply to other financial instruments, such as insurance-related financial assets and financial liabilities, liabilities under financial guarantee contracts, and assets and liabilities arising from finance leases.
Cash and cash equivalents
This item comprises the cash and cash equivalents held by the Cooperative Financial Network. These include cash on hand, balances with central banks and other government institutions as well as public-sector debt instruments and bills of exchange eligible for refinancing by central banks.
Cash on hand comprises euros and other currencies measured at face value or translated at the buying rate. Balances with central banks and other government institutions as well as public-sector debt instruments and bills of exchange eligible for refinancing by central banks are measured at amortized cost.
Loans and advances to banks and costumers
All receivables attributable to registered debtors and not classified as “financial assets held for trading“ are recognized as loans and advances to banks and customers. In addition to fixed-term receivables and receivables payable on demand in connection with lending, lease, and money market business, loans and advances to banks and customers include promissory notes and registered bonds.
Generally, loans and advances to banks and customers are measured at amortized cost. In fair value hedges, the carrying amounts of hedged receivables are adjusted by the change in the fair value attributable to the hedged risk. To avoid accounting anomalies, certain loans and advances are designated as at fair value through profit or loss. Receivables under finance leases are measured upon initial recognition in the balance sheet at an amount equal to the net investment in the lease at the inception of the lease. Lease payments are apportioned into payment of interest and repayment of principal. The interest portion based on the internal discount rate of the lease transaction for a constant periodic rate of return is recognized as interest income, whereas the repayment of principal reduces the carrying amount of the receivable.
Interest income on loans and advances to banks and customers is recognized as interest income from lending and money market operations. This also includes gains and losses on the amortization of hedge adjustments to carrying amounts due to fair value hedges. Hedge adjustments are recognized within other gains and losses on valuation of financial instruments under gains and losses arising on hedging transactions. Gains and losses on loans and advances designated as at fair value through profit or loss are also recognized in other gains and losses on valuation of financial instruments.
Allowances for losses on loans and advances
Financial assets not measured at fair value through profit or loss have to be reviewed at each reporting date to determine whether there is objective evidence of impairment. If such objective evidence is available, specific allowances in the amount of the determined impairment loss requirement are recognized for financial assets. Financial assets with similar features for which impairment losses are not recognized on an individual basis are grouped into portfolios and assessed collectively for possible impairment. Impairment losses are calculated on the basis of historical default rates for comparable portfolios. If any impairment is identified, a portfolio loan loss allowance is recognized.
The allowance for losses on loans and advances to banks and to customers is reported as a separate line item on the assets side of the balance sheet. Additions to and reversals of allowances for losses on loans and advances to banks and to customers are recognized in the income statement under allowances for losses on loans and advances.
The recognition of allowances for losses on loans and advances in the Cooperative Financial Network also includes changes in the provisions for loan commitments and liabilities from financial guarantee contracts. Additions to and reversals of these items are also recognized in the income statement under allowance for losses on loans and advances.
Derivatives used for hedging (positive and negative fair values)
Derivatives used for hedging (positive and negative market values) include the carrying amounts of derivative financial instruments designated as hedging instruments in an effective and documented hedging relationship within the meaning of IAS 39.
Changes in the fair value of hedging instruments in fair value hedges are recognized in the income statement. If the hedging instruments are intended as a cash flow hedge or a hedge of a net investment in a foreign operation, changes in fair value attributable to the effective portion of the hedge are recognized as other comprehensive income.
Financial assets and financial liabilities held for trading
Financial assets and financial liabilities held for trading include derivatives with positive and negative fair values that were entered into for trading purposes or that do not meet the requirements for an accounting treatment as hedging instruments.
Financial assets held for trading also include securities and loans and advances which are held for trading purposes as well as items related to commodities transactions. The loans and advances include promissory notes, registered bonds and money market receivables.
Apart from derivative financial instruments with negative fair values, financial liabilities held for trading include short positions, bonds issued and other debt certificates entered into for trading purposes, liabilities and obligations from commodities transactions. Bonds issued and other debt certificates include share- and index-linked certificates as well as commercial paper. Liabilities result primarily from money market transactions.
Generally, gains and losses on financial instruments reported as financial assets or financial liabilities held for trading are recognized as gains and losses on trading activities. Financial assets and financial liabilities held for trading are recognized at fair value through profit or loss.
Gains and losses on the valuation of derivative financial instruments entered into for hedging purposes, but that do not meet the requirements for classification as a hedging instrument, are recognized under other gains and losses on valuation of financial instruments as gains and losses on derivatives held for purposes other than trading. If, to avoid accounting mismatches, hedged items are classified as ‘financial instruments designated as at fair value through profit or loss’, the valuation gains and losses on the related derivatives concluded for economic hedging purposes are recognized under gains and losses on financial instruments designated as at fair value through profit or loss.
Investments
Investments include securities, shareholdings in subsidiaries and equity investments. Securities comprise bearer bonds and other fixed-income securities as well as shares and other non-fixedincome securities. Investments also include shares in unconsolidated subsidiaries. Equity investments consist of other shareholdings in companies in bearer or registered form where no significant influence exists, as well as interests in joint ventures and associates.
Generally, investments are initially recognized at fair value. Shares, investments in subsidiaries, joint ventures and associates, and other shareholdings for which a fair value cannot be reliably determined or which are accounted for using the equity method are initially recognized at cost.
Property, plant and equipment, and investment property
Property, plant and equipment, and investment property comprise land and buildings, office furniture and equipment, and other fixed assets with an estimated useful life of more than one reporting period used by the Cooperative Financial Network. This item also includes assets subject to operating leases. Investment property is real estate held for the purposes of generating rental income or capital appreciation.
Property, plant and equipment, and investment property is measured at cost less cumulative depreciation and impairment losses in subsequent reporting periods.
Depreciation and impairment losses on property, plant and equipment, and investment property are recognized as administrative expenses. Reversals of impairment losses are reported under other net operating expense/income.
Income tax assets and liabilities
Current and deferred tax assets are shown under the income tax assets balance sheet item; current and deferred tax liabilities are reported under income tax liabilities. Current income tax assets and liabilities are recognized in the amount of any expected refund or future payment.
Deferred tax assets and liabilities are recognized for temporary differences between the carrying amounts recognized in the consolidated financial statements and those of assets and liabilities recognized in the financial statements for tax purposes. Deferred tax assets are also recognized in respect of as yet unused tax loss carryforwards, provided that utilization of these loss carryforwards is sufficiently probable. Deferred tax assets are measured using the national and company-specific tax rates expected to apply at the time of realization.
Deferred tax assets and liabilities are not discounted. Where temporary differences arise in relation to items recognized in other comprehensive income, the resulting deferred tax assets and liabilities are also recognized in other comprehensive income. Current and deferred tax income and expense to be recognized through profit or loss is reported under income taxes in the income statement.
Deposits from banks and customers
All liabilities attributable to registered creditors and not classified as "financial liabilities held for trading" are recognized as deposits from banks and customers. In addition to fixed-maturity liabilities and liabilities repayable on demand arising from the deposit, home savings and money market businesses, these liabilities also include, in particular, registered bonds and promissory notes issued.
Deposits from banks and customers are measured at amortized cost. Where deposits from banks and customers are designated as a hedged item in an effective fair value hedge, the carrying amount is adjusted for any change in the fair value attributable to the hedged risk. To avoid accounting mismatches, certain liabilities are designated as at fair value through profit or loss.
Interest expense on deposits from banks and customers are recognized separately under net interest income. Interest expense also includes gains and losses on early repayment and on the amortization of hedge adjustments to carrying amounts due to fair value hedges. Hedge adjustments to the carrying amount due to fair value hedges are reported within other gains and losses on valuation of financial instruments under gains and losses arising on hedging transactions. Gains and losses on liabilities designated as at fair value through profit or loss are also recognized in other gains and losses on valuation of financial instruments.
Debt certificates issued including bonds
Debt certificates issued including bonds cover issued Pfandbriefe, other bonds and other debt certificates for which transferable bearer certificates have been issued.
Debt certificates issued including bonds and gains and losses thereon are measured and recognized in the same way as deposits from banks and customers.
Provisions
Provisions are recognized for defined benefit obligations, within the context of the lending and home savings businesses, as well as for other uncertain liabilities to third parties.
Actuarial reports are used to calculate the carrying amounts of defined benefit obligations. These include assumptions about long-term salary and pension trends and average life expectancy. Assumptions about salary and pension trends are based on past trends and take account of expectations about future labor market trends. Recognized biometric tables (mortality tables published by Professor Dr. Klaus Heubeck) are used to estimate average life expectancy. The discount rate used to discount future payment obligations is an appropriate market interest rate for high-quality fixed-income corporate bonds with a maturity equivalent to that of the defined benefit obligations. Actuarial gains and losses arising from experience adjustments and changes in actuarial assumptions regarding defined benefit obligations as well as gains and losses on remeasurements of plan assets are recognized as other comprehensive income in the financial year in which they occur.
Other provisions are measured based on the best estimate of the present value of their anticipated utilization, taking into account risks and uncertainties associated with the issues concerned as well as future events. The outflows of funds actually materializing in future may differ from the estimated utilization of provisions.
Provisions for loans and advances factor in the usual sector-specific level of uncertainty about amounts and maturity dates. Provisions relating to building society operations are recognized to cover the payment of any bonuses that may have been agreed in the terms and conditions of home savings contracts.
Subordinated capital
Subordinated capital comprises all debt instruments in bearer or registered form that, in the event of insolvency or liquidation, are repaid only after settlement of all unsubordinated liabilities but before distribution to shareholders of any proceeds from the insolvency or liquidation.
Subordinated capital comprises subordinated liabilities and profit-sharing rights as well as regulatory core capital not included in equity, which is recognized as hybrid capital. The share capital repayable on demand comprises non-controlling interests in partnerships controlled by companies in the Cooperative Financial Network. These non-controlling interests must be classified as subordinated.
Subordinated capital and gains and losses on these certificates are measured and recognized in the same way as deposits from banks and customers.
Equity
Equity represents the residual value of the Cooperative Financial Network's assets minus its liabilities. Cooperative shares of the independent local cooperative banks and capital of silent partners are treated as economic equity in the consolidated financial statements and are recognized as equity. Equity thus comprises subscribed capital – consisting of cooperative shares or share capital and capital of silent partners – plus capital reserves of the local cooperative banks. It also includes equity earned by the Cooperative Financial Network, the reserve resulting from the fair value measurement of available-for-sale financial assets (revaluation reserve), the cash flow hedge reserve, the currency translation reserve, and the non-controlling interests in the equity of consolidated subsidiaries.
Trust activities
Trust activities are defined as business transacted on one's own behalf for a third-party account. Assets and liabilities held as part of trust activities do not satisfy the criteria for recognition on the balance sheet.
Income and expenses arising from trust activities are recognized as fee and commission income or as fee and commission expenses. Income and expenses resulting from the passing-through and administration of trust loans are netted and are included in the fee and commission income earned from lending and trust activities.
Insurance business
Insurance business in the Cooperative Financial Network is generally reported under specific insurance items on the face of the income statement and balance sheet.
Financial assets and financial liabilities
Financial assets and financial liabilities held or entered into in connection with insurance operations are generally accounted for and measured in accordance with IAS 39. They are reported in the investments held by insurance companies, or in the other assets and other liabilities of insurance companies. Impairment losses on financial assets recognized under the investments and the other assets of insurance companies are directly deducted from the assets' carrying amounts.
In addition to financial instruments within the scope of IAS 39, certain financial assets and financial liabilities are held as part of the insurance business and, as required by IFRS 4.25(c), are recognized and measured in accordance with the provisions of the HGB and other German accounting standards applicable to insurance companies. These financial assets and financial liabilities include deposits with ceding insurers, deposits received from reinsurers, receivables and payables arising out of direct insurance operations, and assets related to unit-linked contracts.
Insurance liabilities
Insurance companies are permitted to continue applying existing accounting policies to certain insurance-specific items during a transition period. Insurance liabilities are therefore recognized and measured in accordance with the provisions of the HGB and other German accounting standards applicable to insurance companies. Insurance liabilities are shown before the deduction of the share of reinsurers, which is reported as an asset.
Leases
A lease is classified as a finance lease if substantially all the risks and rewards incidental to the ownership of an asset are transferred from the lessor to the lessee. If a lease is classified as a finance lease, a receivable due from the lessee must be recognized. The receivable is measured at an amount equal to the net investment in the lease at the inception of the lease. Lease payments are apportioned into payment of interest and repayment of principal. Revenue is recognized as interest income on an accrual basis.
B Selected disclosures of interests in other entities
Investment in subsidiaries
Share in the business operations of the Cooperative Financial Network attributable to non-controlling interests
DZ BANK AG Deutsche Zentral-Genossenschaftsbank (DZ BANK) and Westdeutsche Genossenschafts-Zentralbank AG (WGZ BANK) are included in the consolidated financial statements together with their respective subsidiaries as a subgroup. In this context, DZ BANK and WGZ BANK are focused on their clients and owners, the local cooperative banks, as central bank, commercial bank and holding company. The objective of this focus is to sustainably expand the position of the Cooperative Financial Network as one of the leading groups providing comprehensive financial services.
The shares of DZ BANK, with its headquarters in Frankfurt/Main, Germany, are held by the primary banks and by MHB, with ownership interests amounting to 85.4 percent (2013: 83.8 percent). Another 6.7 percent (2013: 6.7 percent) of the shares are held by WGZ BANK. The remaining shares of 7.9 percent (2013: 9.5 percent) are attributable to shareholders that are not part of the Cooperative Financial Network. The pro-rata share in net profit attributable to non-controlling interests amounts to €241 million (2013: €182 million). The carrying amount of non-controlling interests amounts to €3,279 million (2013: €3,060 million). In the financial year under review, the dividend payment made to non-controlling interests amounts to €62 million (2013: €53 million).
The shares of WGZ BANK, with its headquarters in Düsseldorf, Germany, are held by the primary banks with ownership interests amounting to 98.1 percent (2013: 97.8 percent). The remaining shares of 1.9 percent (2013: 2.2 percent) are attributable to shareholders that are not part of the Cooperative Financial Network. The pro-rata share in net profit attributable to non-controlling interests amounts to €11 million (2013: €16 million). The carrying amount of non-controlling interests amounts to €69 million (2013: €60 million). In the financial year under review, the dividend payment made to non-controlling interests amounts to €1 million, unchanged from the prior year.
Nature and extent of significant limitations
National regulatory requirements, contractual provisions, and provisions of company law restrict the ability of the DZ BANK Group companies included in the consolidated financial statements to transfer assets within the group. Where these restrictions can be specifically assigned to individual line items on the balance sheet, the carrying amounts of the assets subject to restrictions on the balance sheet date are shown in the following table:
| Dec. 31, 2014 € million | Dec. 31, 2013 € million | Change (percent) | |
|---|---|---|---|
| Assets | 65,811 | 62,046 | 6.1 |
| Investment held by Insurance companies | 65,811 | 62,046 | 6.1 |
| Liabilities | 63,243 | 59,442 | 6.4 |
| Insurance liabilities | 63,243 | 59,442 | 6.4 |
Nature of the risks associated with interests in consolidated structured entities
Risks arising from interests in consolidated structured entities largely result from loans to fully consolidated funds within the DZ BANK Group, some of which are extended in the form of junior loans.
Interests in joint arrangements and investments in associates
Nature, extent and financial effects of interests in joint arrangements
The carrying amount of individually immaterial joint ventures accounted for using the equity method totaled €615 million as at the balance sheet date (2013: €651 million).
Aggregated financial information for joint ventures accounted for using the equity method that individually are not material:
| 2014 € million | 2013 € million | Change (percent) | |
|---|---|---|---|
| Share of profit from continuing operations | 95 | 154 | –38.3 |
| Share of other comprehensive income/loss | 56 | –48 | >100.0 |
| Pro-rata share in total comprehensive income | 151 | 106 | 42.5 |
Nature, extent and financial effects of interests in associates
The carrying amount of individually immaterial associates accounted for using the equity method totaled €369 million as at the balance sheet date (2013: €344 million).
Aggregated financial information for associates accounted for using the equity method that individually are not material:
| 2014 € million | 2013 € million | Change (percent) | |
|---|---|---|---|
| Share of profit from continuing operations | 21 | 31 | –32.3 |
| Share of profit from discontinued operations | 1 | – | – |
| Share of other comprehensive income/loss | –6 | 9 | >100.0 |
| Pro-rata share in total comprehensive income | 16 | 40 | –60.0 |
Shares in unconsolidated structured entities
Structured entities are entities that have been designed so that voting rights or similar rights are not the dominant factor in deciding who controls the entity. The Cooperative Financial Network mainly distinguishes between the following types of interests in unconsolidated structured entities, based on their design and the related risks; these entities largely concern companies of the DZ BANK Group:
- Shares in investment funds issued by the Cooperative Financial Network,
- Shares in investment funds not issued by the Cooperative Financial Network,
- Interests in securitization vehicles,
- Interests in asset-leasing vehicles
Shares in investment funds issued by the Cooperative Financial Network
The interests in the investment funds issued by the Cooperative Financial Network largely comprise investment funds issued by entities in the Union Investment Group in accordance with the contractual form model without voting rights and, to a lesser extent, those that are structured as a company with a separate legal personality. Furthermore, the DVB Bank Group makes subordinated loans available to fully consolidated funds for the purpose of transport finance. In turn, these funds make subordinated loans or direct equity investments available to unconsolidated entities.
Shares in investment funds not issued by the Cooperative Financial Network
The interests in the investment funds not issued by the Cooperative Financial Network above all comprise investment funds managed by entities in the Union Investment Group within the scope of their own decision-making powers that have been issued by entities outside the Cooperative Financial Network and parts of such investment funds. The DZ BANK Group also extends loans to investment funds in order to generate interest income. In addition, there are investment funds issued by entities outside the Cooperative Financial Network in connection with unit-linked life insurance of the R+V Group (R+V).
Interests in securitization vehicles
The interests in securitization vehicles are interests in vehicles where the DZ BANK Group’s involvement goes beyond that of an investor.
The material interests in securitization vehicles comprise the two multi-seller ABCP programs: CORAL and AUTOBAHN. DZ BANK acts as sponsor and program agent for both programs. It is also the program administrator for AUTOBAHN.
Interests in asset-leasing vehicles
The interests in asset-leasing vehicles comprise shares in limited partnerships and voting rights, other than the shares in limited partnerships, in partnerships established by VR LEASING for the purpose of real estate leasing (asset-leasing vehicles), in which the asset, and the funding occasionally provided by the DZ BANK Group, are placed.
C Income statement disclosures
| 1. Information on operating segments Financial year 2014 (€ million) | Bank | Retail | Real Estate Finance | Insurance | Other/Consolidation | Total |
|---|---|---|---|---|---|---|
| Net interest income | 1,917 | 17,277 | 1,552 | – | –699 | 20,047 |
| Allowances for losses on loans and advances | –147 | –174 | 9 | – | 13 | –299 |
| Net fee and commission income | 576 | 5,542 | –146 | – | –505 | 5,467 |
| Gains and losses on trading activities | 570 | 210 | –18 | – | –10 | 752 |
| Gains and losses on investments | 61 | 54 | 8 | – | 25 | 148 |
| Other gains and losses on valuation of financial instruments | –39 | 12 | 454 | – | 8 | 435 |
| Premiums earned | – | – | – | 13,927 | – | 13,927 |
| Gains and losses on investments held by insurance company gains and losses | – | – | – | 4,481 | –93 | 4,388 |
| Insurance benefit payments | – | – | – | –15,264 | – | –15,264 |
| Insurance business operating expenses | – | – | – | –2,284 | 514 | –1,770 |
| Administrative expenses | –1,675 | –14,880 | –735 | – | 395 | –16,895 |
| Other net operating expense/income | –167 | –196 | 57 | –4 | 29 | –281 |
| Profit before taxes | 1,096 | 7,845 | 1,181 | 856 | –323 | 10,655 |
| Cost/income ratio (percent) | 57.4 | 65.0 | 38.5 | – | – | 60.7 |
| Financial year 2013 € million | Bank | Retail | Real Estate Finance | Insurance | Other/Consolidation | Total |
|---|---|---|---|---|---|---|
| Net interest income | 2,096 | 17,083 | 1,554 | – | –723 | 20,010 |
| Allowances for losses on loans and advances | –416 | –291 | –34 | – | –33 | –774 |
| Net fee and commission income | 567 | 5,239 | –292 | – | –453 | 5,061 |
| Gains and losses on trading activities | 269 | 227 | 14 | – | –3 | 507 |
| Gains and losses on investments | –88 | –408 | –20 | – | –7 | –523 |
| Other gains and losses on valuation of financial instruments | 39 | 21 | 1,021 | – | –4 | 1,077 |
| Premiums earned | – | – | – | 12,693 | – | 12,693 |
| Gains and losses on investments held by insurance company gains and losses | – | – | – | 2,923 | –107 | 2,816 |
| Insurance benefit payments | – | – | – | –13,181 | – | –13,181 |
| Insurance business operating expenses | – | – | – | –2,126 | 464 | –1,662 |
| Administrative expenses | –1,652 | –14,530 | –693 | – | 389 | –16,486 |
| Other net operating expense/income | –12 | 5 | 55 | –57 | 24 | 15 |
| Profit before taxes | 803 | 7,346 | 1,605 | 252 | –453 | 9,553 |
| Cost/income ratio (percent) | 57.5 | 65.5 | 29.7 | – | – | 61.5 |
Definition of operating segments
The Volksbanken Raiffeisenbanken Cooperative Financial Network is founded on the underlying principle of decentralization. It is based on the local primary banks, whose business activities are supported by the two central institutions – DZ BANK and WGZ BANK – and by specialized service providers within the cooperative sector. These specialized service providers are integrated into the central institutions. The main benefit derived by the primary banks from their collaboration with these specialized services providers and the central institutions is that they can offer a full range of financial products and services.
The Bank operating segment combines the activities of the Cooperative Financial Network in the corporate customers, institutional customers and capital markets businesses. The operating segment focuses on corporate customers. It essentially comprises DZ BANK, WGZ BANK, the VR LEASING Group, the DVB Bank Group, DZ BANK Ireland plc, and WGZ BANK Ireland plc.
The Retail operating segment covers private banking and activities relating to asset management. The segment focuses on retail clients. It mainly includes primary banks as well as the DZ PRIVATBANK, TeamBank AG Nürnberg (Team-Bank) and Union Investment Group.
The Real Estate Finance operating segment encompasses the home savings and loan operations, mortgage banking, and real estate business. The entities allocated to this operating segment include Bausparkasse Schwäbisch Hall Group (BSH), Deutsche Genossenschafts-Hypothekenbank AG, WL BANK AG Westfälische Landschaft Bodenkreditbank, and MHB. In the prior year, WGZ Immobilien + Treuhand Gruppe and WGZ Immobilien + Management GmbH had been included up until their deconsolidation.
Insurance operations are reported under the Insurance operating segment. This operating segment consists solely of R+V. Other/Consolidation contains the BVR protection scheme, whose task is to avert impending or existing financial difficulties faced by member institutions by taking preventive action or implementing restructuring measures. This operating segment also includes intersegment consolidation items.
Presentation of the disclosures on operating segments
The information on operating segments presents the interest income generated by the operating segments and the associated interest expenses on a netted basis as net interest income.
Intersegment consolidation
The adjustments to the figure for net interest income resulted largely from the consolidation of dividends paid within the Cooperative Financial Network.
The figure under Other/Consolidation for net fee and commission income relates specifically to the fee and commission business transacted between the primary banks, TeamBank, BSH, and R+V.
The figure under Other/Consolidation for administrative expenses includes the contributions paid to the BVR protection scheme by member institutions of the Cooperative Financial Network.
The remaining adjustments are largely attributable to the consolidation of income and expenses.
| 2. Net interest income | 2014 € million | 2013 € million | Change (percent) |
|---|---|---|---|
| Interest income and current income and expenses | 30,657 | 31,822 | –3.7 |
| Interest income from | 29,307 | 30,360 | –3.5 |
| Lending and money market business | 25,709 | 26,443 | –2.8 |
| of which: building society operations | 1,008 | 991 | 1.7 |
| finance leases | 232 | 320 | –27.5 |
| Fixed-income securities | 4,121 | 4,422 | –6.8 |
| Other assets | –523 | –505 | 3.6 |
| Current income fron | 1,224 | 1,300 | –5.8 |
| Shares and other variable-yield securities | 1,144 | 1,172 | –2.4 |
| Investments in subsidiaries and equity investments | 89 | 93 | –4.3 |
| Operating leases | –9 | 35 | >100.0 |
| Income/loss from using the equity method for | 46 | 81 | –43.2 |
| Interests in joint ventures | 36 | 68 | –47.1 |
| Investments in associates | 10 | 13 | –23.1 |
| Income from profit-pooling, profit-transfer and partial profit-transfer agreements | 80 | 81 | –1.2 |
| Interest expense | –10,610 | –11,812 | –10.2 |
| Interest expense on | –9,964 | –11,148 | –10.6 |
| Deposits from banks and customers | –7,882 | –8,997 | –12.4 |
| of which: building society operations | –773 | –742 | 4.2 |
| Debt certificates issued including bonds | –1,825 | –1,880 | –2.9 |
| Subordinated capital | –297 | –323 | –8.0 |
| Other liabilities | 40 | 52 | –23.1 |
| Other interest expense | –646 | –664 | –2.7 |
| Total | 20,047 | 20,010 | 0.2 |
The interest income from other assets and the interest expense on other liabilities result from gains and losses on the amortization of fair value changes of the hedged items in portfolio hedges of interest-rate risk.
| 3. Allowances for losses on loans and advances | 2014 € million | 2013 € million | Change (percent) |
|---|---|---|---|
| Additions | –2,467 | –2,807 | –12.1 |
| Reversals | 2,092 | 2,027 | 3.2 |
| Directly recognized impairment losses | –187 | –233 | –19.7 |
| Recoveries on loans and advances previously impaired | 296 | 230 | 28.7 |
| Changes in the provisions for loans and advances as well as in the liabilities from financial guarantee contracts | –27 | 22 | >100.0 |
| Impairment losses in available for sale loans and advances | –6 | –13 | –53.8 |
| Total | –299 | –774 | –61.4 |
| 4. Net fee and commission income | 2014 € million | 2013 € million | Change (percent) |
|---|---|---|---|
| Fee and commission income | 6,793 | 6,530 | 4.0 |
| Securities business | 2,912 | 2,861 | 1.8 |
| Asset management | 283 | 174 | 62.6 |
| Payments processing including card processing | 2,345 | 2,240 | 4.7 |
| Lending business and trust activities | 264 | 270 | –2.2 |
| Financial guarantee contracts and loan commitments | 182 | 178 | 2.2 |
| International business | 112 | 115 | –2.6 |
| Building society operations | 29 | 355 | –91.8 |
| Other | 663 | 337 | 96.7 |
| Income from negative effective interest rates for financial liabilities | 3 | – | – |
| Fee and commission expense | –1,326 | –1,469 | –9.7 |
| Securities business | –423 | –588 | –28.1 |
| Asset management | –89 | –10 | >100.0 |
| Payments processing including card processing | –286 | –252 | 13.5 |
| Lending business and trust activities | –117 | –124 | –5.6 |
| Financial guarantee contracts and loan commitments | –11 | –15 | –26.7 |
| International business | –22 | –23 | –4.3 |
| Building society operations | –129 | –376 | –65.7 |
| Other | –248 | –81 | >100.0 |
| Expenses from negative effective interest rates for financial liabilities | –1 | – | – |
| Total | 5,467 | 5,061 | 8.0 |
| 5. Gains and losses on trading activities | 2014 € million | 2013 € million | Change (percent) |
|---|---|---|---|
| Gains and losses in financial instruments | 637 | 235 | >100.0 |
| Gains and losses in foreign exchange, foreign notes and coins, and precious metals | –74 | 80 | >100.0 |
| Gains and losses on commodities trading | 189 | 192 | –1.6 |
| Total | 752 | 507 | 48.3 |
| 6. Gains and losses on investments | 2014 € million | 2013 € million | Change (percent) |
|---|---|---|---|
| Gains and losses on securities | 83 | –502 | >100.0 |
| Gains and losses on investments in subsidiaries and equity investments | 65 | –21 | >100.0 |
| Total | 148 | –523 | >100.0 |
| 7. Other gains and losses on valuation of financial instruments | 2014 € million | 2013 € million | Change (percent) |
|---|---|---|---|
| Gains and losses from hedge accounting | –27 | –21 | 28.6 |
| Fair value hedges | –27 | –21 | 28.6 |
| Gains and losses on hedging instruments | –3,776 | 2,848 | >100.0 |
| Gains and losses on hedged items | 3,749 | –2,869 | >100.0 |
| Gains and losses on derivatives held for purposes other than trading | 2 | 66 | –97.0 |
| Gains and losses on financial instruments designated as at fair value through profit or loss | 460 | 1,032 | –55.4 |
| Total | 435 | 1,077 | –59.6 |
| 8. Premiums earned | 2014 € million | 2013 € million | Change (percent) |
|---|---|---|---|
| Net premiums written | 13,957 | 12,666 | 10.2 |
| Gross premiums written | 14,040 | 12,753 | 10.1 |
| Reinsurance premiums ceded | –83 | –87 | –4.6 |
| Change in provision for unearned premiums | –30 | 27 | >100.0 |
| Gross premiums | –29 | 28 | >100.0 |
| Reinsurers' share | –1 | –1 | – |
| Total | 13,927 | 12,693 | 9.7 |
| 9. Gains and losses on investments held by insurance company gains and losses | 2014 € million | 2013 € million | Change (percent) |
|---|---|---|---|
| Interest income and current income | 2,587 | 2,548 | 1.5 |
| Administrative expenses | –122 | –113 | 8.0 |
| Gains and losses on valuation and disposals | 1,809 | 250 | >100.0 |
| Other gains and losses of insurance companies | 114 | 131 | –13.0 |
| Total | 4,388 | 2,816 | 55.8 |
| 10. Insurance benefit payments | 2014 € million | 2013 € million | Change (percent) |
|---|---|---|---|
| Expenses for claims | –9,487 | –8,765 | 8.2 |
| Gross expenses for claims | –9,524 | –9,055 | 5.2 |
| Reinsurers's share | 37 | 290 | –87.2 |
| Changes in benefit reserve, provisions for premium refunds and in other insurance liabilities | –5,777 | –4,416 | 30.8 |
| Changes in gross liabilities | –5,765 | –4,408 | 30.8 |
| Reinsurers's share | –12 | –8 | 50.0 |
| Total | –15,264 | –13,181 | 15.8 |
| 11. Insurance business operating expenses | 2014 € million | 2013 € million | Change (percent) |
|---|---|---|---|
| Gross expenses | –1,786 | –1,683 | 6.1 |
| Reinsurers's share | 16 | 21 | –23.8 |
| Total | –1,770 | –1,662 | 6.5 |
| 12. Administrative expenses | 2014 € million | 2013 € million | Change (percent) |
|---|---|---|---|
| Staff expenses | –10,059 | –9,782 | 2.8 |
| General and administrative expenses | –5,904 | –5,810 | 1.6 |
| Deprecation/amortization and impairment losses | –932 | –894 | 4.3 |
| Total | –16,895 | –16,486 | 2.5 |
| 13. Other net operating expense/income | 2014 € million | 2013 € million | Change (percent) |
|---|---|---|---|
| Gains and losses on non-current assets classified as held for sale and disposal groups | 1 | 10 | –90.0 |
| Other operating income | 1,009 | 1,004 | 0.5 |
| Other operating expenses | –1,291 | –999 | 29.2 |
| Total | –281 | 15 | >100.0 |
| 14. Income taxes | 2014 € million | 2013 € million | Change (percent) |
|---|---|---|---|
| Current tax expense | –2,508 | –2,490 | 0.7 |
| Expense in deferred taxes | –340 | –201 | 69.2 |
| Total | –2,848 | –2,691 | 5.8 |
Current taxes in relation to the German limited companies are calculated using an effective corporation tax rate of 15.825 percent based on a corporation tax rate of 15 percent plus the solidarity surcharge. The effective rate for trade tax is 14.0 percent based on an average trade tax multiplier of 400 percent. The tax rates correspond to those for the previous year.
Deferred taxes must be calculated using tax rates expected to apply when the tax asset or liability arises. The tax rates used are therefore those that are valid or have been announced for the periods in question as at the balance sheet date.
| 2014 € million | 2013 € million | Change (percent) | |
|---|---|---|---|
| Profit before taxes | 10,655 | 9,553 | 11.5 |
| National rate of income tax of the Cooperative Financial Network (percent) | 29,825 | 29,825 | |
| Income taxes based on notional rate of income tax | –3,178 | –2,849 | 11.5 |
| Tax effects | 330 | 158 | >100.0 |
| Tax effects of tax-exempt income and non-tax deductible expenses | 179 | 112 | 59.8 |
| Tax effects of different tax types, different trade tax multipliers, and changes in tax rates | –1 | 44 | >100.0 |
| Tax effects of different tax rates in other countries | 8 | –4 | –75.0 |
| Current and deferred taxes relating to prior reporting periods | 166 | –59 | >100.0 |
| Reversal of valuation adjustments of deferred tax assets | 43 | 2 | >100.0 |
| Other tax effects | –65 | 63 | >100.0 |
| Total | –2,848 | –2,691 | 5.8 |
The table shows a reconciliation from notional income taxes to recognized income taxes based on application of the current tax law in Germany.
D Balance sheet disclosures
| 15. Cash and cash equivalents | Dec. 31, 2014 € million | Dec. 31, 2013 € million | Change (percent) |
|---|---|---|---|
| Cash on hands | 6,409 | 6,348 | 1.0 |
| Balances with central banks and other government institutions | 9,247 | 9,560 | –3.3 |
| of which: with Deutsche Bundesbank | 6,941 | 8,765 | –20.8 |
| Public sector debt instruments and bills of exchange eligible for refinancing y central banks | – | 72 | –100.0 |
| Total | 15,656 | 15,980 | –2.0 |
| 16. Loans and advances to banks and customers | Dec. 31, 2014 € million | Dec. 31, 2013 € million | Change (percent) |
|---|---|---|---|
| Loans and advances to banks | 38,293 | 33,413 | 14.6 |
| Repayable on demand | 17,331 | 10,623 | 63.1 |
| Other loans and advances | 20,962 | 22,790 | –8.0 |
| Mortgage loans and other loans secured by mortgages on real estate | 74 | 665 | –88.9 |
| Local authority loans | 10,557 | 11,019 | –4.2 |
| Other loans and advances | 10,331 | 11,106 | –7.0 |
| Loans and advances to customers | 670,683 | 648,470 | 3.4 |
| Mortgage loans and other loans secured by mortgages on real estate | 256,703 | 238,148 | 7.8 |
| Local authority loans | 41,383 | 43,418 | –4.7 |
| Home saving loans advanced by building society | 29,960 | 27,259 | 9.9 |
| of which: from allotment (home savings loan) | 4,437 | 4,897 | –9.4 |
| for advance and interim financing | 23,377 | 20,264 | 15.4 |
| other building loans | 2,146 | 2,098 | 2.3 |
| Finance leases | 4,118 | 4,872 | –15.5 |
| Other loans and advances | 338,519 | 334,773 | 1.1 |
| 17. Allowances for losses on loans and advances | Specific loan loss allowances € million | Portfolio loan loss allowances € million | Total € million |
|---|---|---|---|
| Balance as at Jan. 1, 2013 | 8,550 | 1,235 | 9,785 |
| Additions | 2,613 | 208 | 2,821 |
| Utilizations | –1,215 | – | –1,215 |
| Reversals | –1,818 | –245 | –2,063 |
| Changes in scope of consolidation | –9 | –22 | –31 |
| Other changes | –18 | 5 | –13 |
| Balance as at Dec. 31, 2013 | 8,103 | 1,181 | 9284 |
| Additions | 2,271 | 196 | 2,467 |
| Utilizations | –1,132 | – | –1,132 |
| Reversals | –1,824 | –305 | –2,129 |
| Other changes | 36 | –7 | 29 |
| Balance as at Dec. 31, 2014 | 7,454 | 1,065 | 8,519 |
| 18. Derivatives used for hedging (positive and negative fair values) | Dec. 31, 2014 € million | Dec. 31, 2013 € million | Change (percent) |
|---|---|---|---|
| Derivatives used for hedging (positive fair value) | 1,099 | 1,382 | –20.5 |
| Fair value hedges | 1,095 | 1,370 | –20.1 |
| Cash flow hedges | 4 | 11 | –63.6 |
| Hedges of net investments in foreign operations | – | 1 | –100.0 |
| Derivatives used for hedging (negative fair value) | 10,423 | 7,178 | 45.2 |
| Fair value hedges | 10,395 | 7,176 | 44.9 |
| Cash flow hedges | 27 | 2 | >100.0 |
| Hedges of net investments in foreign operations | 1 | – | – |
| 19. Financial assets held for trading | Dec. 31, 2014 € million | Dec. 31, 2013 € million | Change (percent) |
|---|---|---|---|
| Derivatives (positive fair values) | 31,884 | 24,550 | 29.9 |
| Interest-linked contracts | 28,301 | 21,418 | 32.1 |
| Currency-linked contracts | 2,104 | 1,013 | >100.0 |
| Share- and index-linked contracts | 426 | 582 | –26.8 |
| Credit derivatives | 400 | 463 | –13.6 |
| Other contracts | 653 | 1,074 | –39.2 |
| Securities | 17,182 | 15,330 | 12.1 |
| Bonds and other fixed-income securities | 16,433 | 14,723 | 11.6 |
| Shares and other variable-yield securities | 749 | 607 | 23.4 |
| Loans and advances | 11,744 | 17,288 | –32.1 |
| Inventories and trade receivables | 371 | 371 | – |
| Total | 61,181 | 57,539 | 6.3 |
| 20. Investments | Dec. 31, 2014 € million | Dec. 31, 2013 € million | Change (percent) |
|---|---|---|---|
| Securities | 245,949 | 233,664 | 5.3 |
| Bonds and other fixed-income securities | 197,228 | 187,383 | 5.3 |
| Shares and other variable-yield securities | 48,721 | 46,281 | 5.3 |
| Investments in subsidiaries | 1,106 | 1,202 | –8.0 |
| Equity investments | 2,164 | 2,391 | –9.5 |
| Investments in joint ventures | 597 | 633 | –5.7 |
| Investments in associates | 391 | 359 | 8.9 |
| Other shareholdings | 1,176 | 1,399 | –15.9 |
| Total | 249,219 | 237,257 | 5.0 |
| 21. Investments held by insurance companies | Dec. 31, 2014 € million | Dec. 31, 2013 € million | Change (percent) |
|---|---|---|---|
| Investment Property | 1,924 | 1,595 | 20.6 |
| Investment in subsidiaries, joint ventures and in associates | 504 | 649 | –22.3 |
| Mortgage loans | 8,047 | 7,257 | 10.9 |
| Promissory notes and loans | 8,043 | 8,213 | –2.1 |
| Registered bonds | 9,376 | 9,027 | 3.9 |
| Other loans | 898 | 1,101 | –18.4 |
| Variable-yield securities | 6,248 | 5,156 | 21.2 |
| Fixed-income securities | 34,457 | 28,284 | 21.8 |
| Derivatives (positive fair values) | 443 | 144 | >100.0 |
| Deposits with ceding insurers | 172 | 174 | –1.1 |
| Assets related to unit-linked contracts | 7,433 | 6,268 | 18.6 |
| Total | 77,545 | 67,868 | 14.3 |
| 22. Property, plant and equipment, and investment property | Dec. 31, 2014 € million | Dec. 31, 2013 € million | Change (percent) |
|---|---|---|---|
| Land and buildings | 6,752 | 6,690 | 0.9 |
| Office furniture and equipment | 1,451 | 1,411 | 2.8 |
| Assets subject to operating leases | 1,200 | 639 | 87.8 |
| Investment Property | 93 | 88 | 5.7 |
| Other fixed assets | 1,933 | 1,840 | 5.1 |
| Total | 11,429 | 10,668 | 7.1 |
| 23. Income tax assets and liabilities | Dec. 31, 2014 € million | Dec. 31, 2013 € million | Change (percent) |
|---|---|---|---|
| Income tax assets | 4,484 | 4,907 | –8.6 |
| Current income tax assets | 1,973 | 2,384 | –17.2 |
| Deferred income tax assets | 2,511 | 2,523 | –0.5 |
| Income tax liabilities | 1,198 | 1,001 | 19.7 |
| Current income tax liabilities | 816 | 755 | 8.1 |
| Deferred income tax liabilities | 382 | 246 | 55.3 |
| Deferred tax assets Dec. 31, 2014 € million | Deferred tax assets Dec. 31, 2013 € million | Deferred tax liabilities Dec. 31, 2014 € million | Deferred tax liabilities Dec. 31, 2013 € million | |
|---|---|---|---|---|
| Tax loss carryforwards | 89 | 99 | ||
| Loans and advances to banks and customers (net) | 35 | 129 | 719 | 484 |
| Financial assets and liabilities held for trading, derivatives used for hedging (positive and negative fair values) | 1,518 | 1,057 | 37 | 161 |
| Investments | 383 | 481 | 1,360 | 426 |
| Investments held by insurance companies | 13 | 15 | 589 | 207 |
| Deposits from banks and customers | 1,079 | 705 | 83 | 132 |
| Debt certificates issued including bonds | 157 | 122 | 22 | 23 |
| Provisions | 1,966 | 1,349 | 37 | 34 |
| Insurance liabilities | 129 | 88 | 246 | 232 |
| Intangible assets | 1 | – | 29 | – |
| Other balance sheet items | 126 | 149 | 245 | 218 |
| Total (gross) | 5,496 | 4,194 | 3,367 | 1,917 |
| Netting of deferred tax assets and deferred tax liabilities | –2,985 | –1,671 | –2,985 | –1,671 |
| Total (net) | 2,511 | 2,523 | 382 | 246 |
Deferred tax assets and liabilities are recognized for temporary differences in respect of the balance sheet items shown in the table as well as for tax loss carryforwards.
| 24. Other assets | Dec. 31, 2014 € million | Dec. 31, 2013 € million | Change (percent) |
|---|---|---|---|
| Other assets held by insurance companies | 3,790 | 4,096 | –7.5 |
| Goodwill | 121 | 120 | 0.8 |
| Other intangible assets | 272 | 292 | –6.8 |
| Prepaid expenses | 211 | 312 | –32.4 |
| Other receivables | 2,791 | 2,810 | –0.7 |
| Non-current assets and disposal groups classified as held for sale | 33 | 11 | >100.0 |
| Fair value changes of the hedged items in portfolio hedges of interest-rate risk | 7,008 | 4,211 | 66.4 |
| Residual other assets | 464 | 513 | –9.6 |
| Total | 14,690 | 12,365 | 18.8 |
| 25. Deposits from banks and customers | Dec. 31, 2014 € million | Dec. 31, 2013 € million | Change (percent) |
|---|---|---|---|
| Deposits from banks | 103,526 | 96,210 | 7.6 |
| Repayable on demand | 10,349 | 10,741 | –3.6 |
| With agreed maturity or notice period | 93,177 | 85,469 | 9.0 |
| Deposits from customers | 713,485 | 693,191 | 2.9 |
| Savings deposits and home savings deposits | 237,205 | 234,160 | 1.3 |
| Savings deposits with agreed notice period of three months | 169,869 | 169,611 | 0.2 |
| Savings deposits with agreed notice period of more than three months | 18,993 | 19,566 | –2.9 |
| Home savings deposits | 48,343 | 44,983 | 7.5 |
| Other deposits from customers | 476,280 | 459,031 | 3.8 |
| Repayable on demand | 339,360 | 314,037 | 8.1 |
| With agreed maturity or notice period | 136,920 | 144,994 | –5.6 |
| 26. Debt certificates issued including bonds | Dec. 31, 2014 € million | Dec. 31, 2013 € million | Change (percent) |
|---|---|---|---|
| Bonds issued | 51,803 | 59,376 | –12.8 |
| Mortgage Pfandbriefe | 22,048 | 21,250 | 3.8 |
| Public-sector Pfandbriefe | 11,023 | 15,006 | –26.5 |
| Other bonds | 18,732 | 23,120 | –19.0 |
| Other debt certificates issued | 15,178 | 8,131 | 86.7 |
| Total | 66,981 | 67,507 | –0.8 |
| 27. Financial liabilities held for trading | Dec. 31, 2014 € million | Dec. 31, 2013 € million | Change (percent) |
|---|---|---|---|
| Derivatives (negative fair values) | 32,190 | 23,764 | 35.5 |
| Interest-linked contracts | 27,332 | 20,993 | 30.2 |
| Currency-linked contracts | 1,733 | 1,026 | 68.9 |
| Share- and index-linked contracts | 762 | 770 | –1.0 |
| Credit derivatives | 210 | 312 | –32.7 |
| Other contracts | 2,153 | 663 | >100.0 |
| Short positions | 883 | 749 | 17.9 |
| Bonds issued and other debt certificates | 9,817 | 9,398 | 4.5 |
| Liabilities | 9,827 | 10,352 | –5.1 |
| Liabilities from commodities transactions and commodity lending | 43 | 47 | –8.5 |
| Total | 52,760 | 44,310 | 19.1 |
| 28. Provisions | Dec. 31, 2014 € million | Dec. 31, 2013 € million | Change (percent) |
|---|---|---|---|
| Provisions for defined benefit plans | 9,088 | 7,018 | 29.5 |
| Provisions for loans and advances | 432 | 422 | 2.4 |
| Provisions relating to building society operations | 580 | 516 | 12.4 |
| Residual provisions | 3,561 | 3,400 | 4.7 |
| Total | 13,661 | 11,356 | 20.3 |
| Funding status of defined benefit obligations | Dec. 31, 2014 € million | Dec. 31, 2013 € million | Change (percent) |
|---|---|---|---|
| Present value of defined benefit obligations not funded by plan assets | 8,558 | 7,068 | 21.1 |
| Present value of defined benefit obligations funded by plan assets | 1,745 | 1,090 | 60.1 |
| Present value of defined benefit obligations | 10,303 | 8,158 | 26.3 |
| less fair value of plan assets | –1,215 | –1,145 | 6.1 |
| Defined benefit obligations (net) | 9,088 | 7,013 | 29.6 |
| Recognized surplus | – | 5 | –100.0 |
| Provisions for defined benefit plans | 9,088 | 7,018 | 29.5 |
| Changes in the present value of the defined benefit obligations | 2014 € million | 2013 € million | Change (percent) |
|---|---|---|---|
| Present value of defined benefit obligations as at Jan. 1 | 8,159 | 8,390 | –2.8 |
| Current service cost | 113 | 121 | –6.6 |
| Interest expense | 261 | 272 | –4.0 |
| Pension benefits paid including plan settlements | –345 | –335 | 3.0 |
| past service cost | – | 1 | –100.0 |
| Actuarial gains (-)/losses (+) | 2,100 | –293 | >100.0 |
| Other changes | 15 | 3 | >100.0 |
| Present value of defined benefit obligations as at Dec. 31 | 10,303 | 8,159 | 26.3 |
| Changes in plan assets | 2014 € million | 2013 € million | Change (percent) |
|---|---|---|---|
| Fair value of plan assets as at Jan. 1 | 1,145 | 1,096 | 4.5 |
| Interest income | 34 | 33 | 3.0 |
| Contributions to plan assets | 22 | 76 | –71.1 |
| Pension benefits paid | –47 | –51 | –7.8 |
| return on plan assets (excluding interest income) | 52 | –6 | >100.0 |
| Other changes | 9 | –3 | >100.0 |
| Fair value of plan assets as at Dec. 31 | 1,215 | 1,145 | 6.1 |
| Acturial assumptions used for defined benefit obligations | Dec. 31, 2014 (percent) | Dec. 31, 2013 (percent) |
|---|---|---|
| Discount rate | 1.80–2.00 | 3.14–3.25 |
| Salary increases | 1.50–3.50 | 0.02–3.50 |
| Pension increases | 0.00–3.00 | 0.00–3.00 |
| 29. Insurance liabilities | Dec. 31, 2014 € million | Dec. 31, 2013 € million | Change (percent) |
|---|---|---|---|
| Provision for unearned premiums | 1,071 | 1,035 | 3.5 |
| Benefit reserve | 49,724 | 46,431 | 7.1 |
| Provision for claims outstanding | 8,352 | 7,798 | 7.1 |
| Provisions for premium refunds | 8,568 | 6,240 | 37.3 |
| Other insurance liabilities | 40 | 37 | 8.1 |
| Reserve for unit-linked insurance contracts | 6,915 | 5,845 | 18.3 |
| Total | 74,670 | 67,386 | 10.8 |
| 30. Other liabilities | Dec. 31, 2014 € million | Dec. 31, 2013 € million | Change (percent) |
|---|---|---|---|
| Other liabilities of insurance companies | 4,203 | 4,056 | 3.6 |
| Other liabilities and accruals | 2,382 | 2,544 | –6.4 |
| Fair value changes of the hedged items in portfolio hedges of interest-rate risk | 567 | 464 | 22.2 |
| Residual other liabilities | 667 | 557 | 19.7 |
| Total | 7,819 | 7,621 | 2.6 |
| 31. Subordinated capital | Dec. 31, 2014 € million | Dec. 31, 2013 € million | Change (percent) |
|---|---|---|---|
| Subordinated Liabilities | 4,518 | 4,886 | –7.5 |
| Profit-sharing rights | 196 | 102 | 92.2 |
| Other hybrid capital | – | 363 | –100.0 |
| Share capital repayable on demand | 22 | 68 | –67.6 |
| Total | 4,736 | 5,419 | –12.6 |
E Financial instruments disclosures
| 32. Fair value of financial instruments | Carrying amount Dec. 31, 2014 € million | Fair value Dec. 31, 2014 € million | Carrying amount Dec. 31, 2013 € million | Fair value Dec. 31, 2013 € million |
|---|---|---|---|---|
| Assets | ||||
| Cash and cash equivalents | 9,247 | 9,247 | 9,632 | 9,632 |
| Loans and advances to banks¹ | 38,185 | 39,572 | 33,254 | 34,852 |
| Loans and advances to customers1 | 662,272 | 669,424 | 639,332 | 643,905 |
| Derivatives used for hedging (positive fair value) | 1,099 | 1,099 | 1,382 | 1,382 |
| Financial assets held for trading2 | 60,810 | 60,810 | 57,169 | 57,169 |
| Investments3 | 248,231 | 248,496 | 236,265 | 236,112 |
| Investments held by insurance companies2,3 | 67,977 | 69,311 | 59,773 | 60,657 |
| Other assets2 | 10,192 | 9,342 | 7,671 | 7,256 |
| Liabilities | ||||
| Deposits from banks | 103,526 | 105,070 | 96,210 | 97,890 |
| Deposits from customers | 713,485 | 718,568 | 693,191 | 696,551 |
| Debt certificates issued including bonds | 66,981 | 68,232 | 67,507 | 68,548 |
| Derivatives used for hedging (negative fair value) | 10,423 | 10,423 | 7,178 | 7,178 |
| Financial liabilities held for trading2 | 52,717 | 52,717 | 44,264 | 44,264 |
| Other liabilities2 | 3,122 | 2,561 | 3,171 | 2,710 |
| Subordinated capital | 4,736 | 5,035 | 5,419 | 5,346 |
1 Carrying amounts less loan loss allowances
2 Fair value and carrying amount only include financial instruments
3 Excluding interests in joint ventures and investments in associates
The table shows the disclosures on the fair value of financial instruments included in the published annual reports of the DZ BANK Group and the WGZ BANK Group. For all other companies included in the consolidated financial statements, the fair value was deemed to be equivalent to the carrying amount.
| 33. Maturity analysis | ≤ 3 months € million | > 3 months–1 year € million | > 1 year € million | Indefinite useful life € million |
|---|---|---|---|---|
| Balance as at Dec. 31, 2014 | ||||
| Loans and advances to banks | 15,609 | 4,416 | 24,356 | 564 |
| Loans and advances to customers | 38,319 | 55,690 | 574,018 | 21,067 |
| Deposits from banks | 30,541 | 10,056 | 65,992 | 448 |
| Deposits from customers | 548,880 | 32,532 | 84,651 | 53,315 |
| Debt certificates issued including bonds | 12,103 | 12,099 | 45,285 | – |
| Balance as at Dec. 31, 2013 | ||||
| Loans and advances to banks | 12,384 | 4,417 | 23,761 | 423 |
| Loans and advances to customers | 41,442 | 52,766 | 551,247 | 19,626 |
| Deposits from banks | 27,568 | 10,132 | 62,578 | 443 |
| Deposits from customers | 533,715 | 33,948 | 88,083 | 44,997 |
| Debt certificates issued including bonds | 10,416 | 7,903 | 53,131 | – |
The contractual maturities shown in the table do not match the estimated actual cash inflows and cash outflows.
| 34. Exposures in countries particularly affected by the sovereign debt crisis | Dec. 31, 2014 € million | Dec. 31, 2013 € million | Change (percent) |
|---|---|---|---|
| Portugal | 725 | 786 | –7.8 |
| Italy | 8,182 | 6,305 | 29.8 |
| Ireland | 563 | 506 | 11.3 |
| Greece | 1 | 10 | –90.0 |
| Spain | 4,451 | 3,918 | 13.6 |
| Total | 13,922 | 11,525 | 20.8 |
The table shows the carrying amounts of bonds issued by governments and other public authorities particularly affected by the sovereign debt crisis.
Debt held as part of the insurance business are only recognized in the proportion attributable to the shareholders of the Cooperative Financial Network.
F Other disclosures
| 35. Financial guarantee contracts and loan commitments | Dec. 31, 2014 € million | Dec. 31, 2013 € million | Change (percent) |
|---|---|---|---|
| Financial guarantee contracts and loan commitments | 17,020 | 16,831 | 1.1 |
| Loan commitments | 59,477 | 55,382 | 7.4 |
| Total | 76,497 | 72,213 | 5.9 |
The amounts shown for financial guarantee contracts and loan commitments are the nominal values of the respective exposure.
| 36. Trust activities | Dec. 31, 2014 € million | Dec. 31, 2013 € million | Change (percent) |
|---|---|---|---|
| Trust assets | 2,169 | 4,374 | –50.4 |
| of which: trust loans | 1,127 | 3,340 | –66,.3 |
| Trust liabilities | 2,169 | 4,374 | –50.4 |
| of which: trust loans | 1,127 | 3,340 | –66.3 |
| 37. Asset management by the Union Investment group | Dec. 31, 2014 € million | Dec. 31, 2013 € million | Change (percent) |
|---|---|---|---|
| Fund assets | 205,061 | 182,121 | 12.6 |
| Other types of asset management | 35,132 | 30,007 | 17.1 |
| Unit-linked asset management | 500 | 330 | 51.5 |
| Institutional asset management | 8,401 | 6,221 | 35.0 |
| Advisory und Outsourcing | 26,231 | 23,456 | 11.8 |
| Accounts managed by third parties | –8,136 | –5,967 | 36.3 |
| Total | 232,057 | 206,161 | 12.6 |
As at the balance sheet date, the Union Investment Group (through Union Asset Management Holding) had total assets under management of €232,057 billion (December 31, 2013: €206,161 billion). The fund assets comprise equity funds, fixed-income funds, money market funds, mixed funds, other securities funds, capital preservation funds, real estate funds, alternative investment funds and hybrid funds issued by Union Investment Group.
In addition, Union Investment Group has assets under management within the scope of institutional asset management, unit-linked asset management, and advisory and outsourcing. The fund volume of funds that have been issued by Union Investment Group but whose portfolio management has been outsourced is shown as a deduction. The definition of assets under management is based on the aggregate statistics from the Federal Association of German Fund Management Companies (BVI), Frankfurt/Main.
| 38. Leases Finance leases with the Cooperative Financial Network as lessor | Dec. 31, 2014 € million | Dec. 31, 2013 € million | Change (percent) |
|---|---|---|---|
| Finance leases of the Cooperative Financial Network | 4,628 | 5,587 | –17.2 |
| Up to 1 Year | 1,336 | 1,500 | –10.9 |
| More than 1 year and up to 5 years | 2,655 | 2,957 | –10.2 |
| More than 5 years | 637 | 1,130 | –43.6 |
| less unearned finance income | –540 | –716 | –24.6 |
| Net investment | 4,088 | 4,871 | –16.1 |
| less present value of unguaranteed residual values | –94 | –113 | –16.8 |
| Present value of minimum lease payment receivables | 3,994 | 4,758 | –16.1 |
| Up to 1 Year | 1,146 | 1,271 | –9.8 |
| More than 1 year and up to 5 years | 2,304 | 2,523 | –8.7 |
| More than 5 years | 544 | 964 | –43.6 |
As at the balance sheet date, the accumulated allowance for uncollectable minimum lease payments at lessor companies amounted to €63 million (December 31, 2013: €63 million).
The DVB Bank Group and the VR LEASING Group are active as finance lessors in the Cooperative Financial Network. The entities in the DVB Bank Group primarily enter into leases for ships, ship containers, aircraft, and aircraft engines. Entities in the VR LEASING Group mainly enter into equipment leases with their customers.
| 39. Capital requirements and capital ratios | Dec. 31, 2014 € million | Dec. 31, 2013 € million | Change (percent) |
|---|---|---|---|
| Total capital | 81,565 | 83,503 | –2.3 |
| Tier 1 capital | 62,092 | 59,843 | 3.8 |
| of which: Common equity capital | 60,838 | – | – |
| Additional Tier 1 capital | 1,254 | – | – |
| Tier 2 capital | 19,473 | 24,694 | –21.1 |
| Tier 3 capital1 | - | 1 | - |
| Deductions from Tier 1 and Tier 2 capital2 | – | –1,035 | – |
| Regulatory capital requirements | 43,315 | 41,451 | 4.5 |
| Common equity Tier 1 capital ratio (percent) | 11.2 | – | |
| Tier 1 capital ratio (percent) | 11.5 | 11.4 | |
| Total capital ratio (percent) | 13.8 | 13.8 | |
| Tier 1 capital ratio including reserves pursuant to section 340f of the HGB (percent)3 | 15.1 | 16.1 |
1 Tier 3 capital is no longer permitted to be included as a capital component pursuant to CRR and no longer eligible for the financial year 2014.
2 This item is no longer presented within the scope of the new CRR regulations. Own funds reported (i.e. Tier 1 and Tier 2 capital) have already been reduced by the respective deductions.
3 The balance of reserves pursuant to Section 340f HGB as at December 31, 2014 is based on the financial statements data reported by the primary banks. The balance as at December 31, 2013 results from reports pursuant to the German Solvency Regulation.
The amounts reported as of December 31, 2013 were determined based on the German Solvency Regulation. The disclosures as of December 31, 2014 are based on CRR rules. The disclosures refer to the joint liability scheme of the Cooperative Financial Network and the relevant reporting date. The disclosures in relation to own funds and capital requirements as at December 31, 2014 are based on the results of the extended aggregated calculation in accordance with Art. 49 (3) CRR in conjunction with Art. 113 (7) CRR.
| 40. Changes in the contract portfolios held by Bausparkasse Schwäbisch Hall | Not allocated Number of contracts | Not allocated Home savings sum € million | Allocated, Number of contracts | Allocated, Home savings sum € million | Total Number of contracts | Total Home savings sum € million |
|---|---|---|---|---|---|---|
| Balance as at Dec. 31, 2013 | 7,182,483 | 238,793 | 960,838 | 25,303 | 8,143,321 | 264,096 |
| Additions in 2014 as a result of | ||||||
| New contracts (redeemed contracts)1 | 772,515 | 28,465 | – | – | 772,515 | 28,465 |
| Transfers | 23,365 | 663 | 1,883 | 48 | 25,248 | 711 |
| Allocation waivers and cancellations | 9,220 | 375 | – | – | 9,220 | 375 |
| Splitting | 230,249 | – | 254 | – | 230,503 | – |
| Allocations and acceptance of allocations | – | – | 369,260 | 9,797 | 369,260 | 9,797 |
| Other | 131,025 | 4,568 | 47 | 3 | 131,072 | 4,571 |
| Total | 1,166,374 | 34,071 | 371,444 | 9,848 | 1,537,818 | 43,919 |
| Disposal in 2014 as a result of | ||||||
| Allocations and acceptance of allocations | –369,260 | –9,797 | – | – | –369,260 | –9,797 |
| Reductions | – | –869 | – | – | – | –869 |
| Termination | –303,819 | –7,021 | –243,719 | –5,712 | –547,538 | –12,733 |
| Transfers | –23,365 | –663 | –1,883 | –48 | –25,248 | –711 |
| Pooling1 | –91,377 | – | –2 | – | –91,379 | – |
| Expiration | – | – | –170,897 | –4,670 | –170,897 | –4,670 |
| Allocation waivers and cancellations | – | – | –9,220 | –375 | –9,220 | –375 |
| Other | –131,025 | –4,568 | –47 | –3 | –131,072 | –4,571 |
| Total | –918,846 | –22,918 | –425,768 | –10,808 | –1,344,614 | –33,726 |
| Net addition/disposal | 247,528 | 11,153 | –54,324 | –960 | 193,204 | 10,193 |
| Balance as at Dec. 31, 2014 | 7,430,011 | 249,946 | 906,514 | 24,343 | 8,336,525 | 274,289 |
1 Including increases
| Value of unredeemed contracts | Number of contracts | Home savings sum € million |
|---|---|---|
| Contracts signed prior to Jan 1, 2014 | 68,585 | 2,492 |
| Contracts signed in 2014 | 237,484 | 10,614 |
| 41. Changes in the allocation assets of Bausparkasse Schwäbisch Hall | 2014 € million |
|---|---|
| Additions | |
| Amounts carried forward from 2013 (surplus) | |
| Amounts not yet distributed | 41,142 |
| Additions in 2014 | |
| Savings deposits (including credited residential construction bonuses) | 9,275 |
| Repayable amounts (including credited residential construction bonuses)1 | 2,026 |
| Interest on home savings deposits | 683 |
| Total | 53,126 |
| Withdrawals | |
| Withdrawals in 2014 | |
| Amounts allocated (if disbursed) | |
| Home savings deposits | 5,331 |
| Building loans | 1,556 |
| Repayment of deposits on non-allocated home savings contracts | 1,024 |
| Surplus of additions | |
| (Amounts not yet disbursed) at the end of 20132 | 45,215 |
| Total | 53,126 |
1 Amounts repaid are the portion of the loan principal actually repaid
2 The surplus amounts allocated include:
a undisbursed home savings deposits from allocated home savings contracts: Euro 107 million
b undisbursed home savings loans from funds allocated: Euro 3,977 million
| 42. Cover statement for the mortgages and local authority loans extended by the mortgage banks | Mortgage Pfandbriefe Dec. 31, 2014 € million | Mortgage Pfandbriefe Dec. 31, 2013 € million | Mortgage Pfandbriefe Veränderung (percent) | Public-sector Pfandbriefe Dec. 31, 2014 € million | Public-sector Pfandbriefe Dec. 31, 2013 € million | Public-sector Pfandbriefe Change (percent) |
|---|---|---|---|---|---|---|
| Ordinary cover | 44,730 | 42,830 | 4.4 | 36,243 | 42,751 | –15.2 |
| Loans and advances to banks | 24 | 38 | –36.8 | 2,261 | 3,497 | –35.3 |
| of which: mortgage loans | 24 | 38 | –36.8 | – | – | – |
| local authority loans | – | – | – | 2,261 | 3,497 | –35.3 |
| Loans and advances to customers | 44,560 | 42,646 | 4.5 | 24,939 | 27,565 | –9.5 |
| of which: mortgage loans | 44,560 | 42,646 | 4.5 | 97 | 581 | –83.3 |
| local authority loans | – | – | – | 24,842 | 26,984 | –7.9 |
| Investments consisting of bonds and other fixed-income securities | – | – | – | 6,613 | 8,154 | –18.9 |
| Property, plant and equipment | 146 | 146 | – | 2,430 | 3,535 | –31.3 |
| Extended cover | 1,726 | 2,188 | –21.1 | 348 | 1,190 | –70.8 |
| Loans and advances to banks | – | 150 | –100.0 | 187 | 939 | –80.1 |
| Investments consisting of bonds and other fixed-income securities | 1,726 | 2,038 | –15.3 | 161 | 251 | –35.9 |
| Total cover | 46,456 | 45,018 | 3.2 | 36,591 | 43,941 | –16.7 |
| Pfandbriefe requiring cover | –39,794 | –38,452 | 3.5 | –32,583 | –38,064 | –14.4 |
| Nominal excess cover | 6,662 | 6,566 | 1.5 | 4,008 | 5,877 | –31.8 |
| Present value of excess cover | 9,380 | 9,059 | 3.5 | 4,954 | 6,605 | –25.0 |
| Risk-related present value of excess cover | 8,482 | 8,164 | 3.9 | 4,391 | 6,153 | –28.6 |
The present value of excess cover is higher than the nominal excess cover because it includes an interest component.
| Maturity structure of mortgage Pfandbriefe and public-sector Pfandbriefe in issue | Dec. 31, 2014 € million | Dec. 31, 2013 € million | Change (percent) |
|---|---|---|---|
| Mortgage Pfandbriefe | 39,794 | 38,452 | 3.5 |
| <= 6 months | 2,868 | 3,952 | 33.2 |
| > 6 months and <= 12 months | 2,396 | ||
| > 12 months and <= 18 months | 4,664 | 5,207 | 17.4 |
| > 18 months and <= 2 years | 1,450 | ||
| > 2 years and <= 3 years | 3,522 | 5,784 | –39.1 |
| > 3 years and <= 4 years | 2,274 | 3,460 | –34.3 |
| > 4 years and <= 5 years | 3,193 | 2,054 | 55.5 |
| > 5 years and <= 10 years | 11,947 | 11,022 | 8.4 |
| > 10 years | 7,480 | 6,973 | 7.3 |
| Public-sector Pfandbriefe | 32,583 | 38,064 | –14.4 |
| <= 6 months | 2,267 | 7,894 | –46.0 |
| > 6 months and <= 12 months | 1,996 | ||
| > 12 months and <= 18 months | 1,758 | 4,033 | 32.3 |
| > 18 months and <= 2 years | 3,578 | ||
| > 2 years and <= 3 years | 3,151 | 4,890 | –35.6 |
| > 3 years and <= 4 years | 2,732 | 2,584 | 5.7 |
| > 4 years and <= 5 years | 2,271 | 2,704 | –16.0 |
| > 5 years and <= 10 years | 6,837 | 6,873 | –0.5 |
| > 10 years | 7,993 | 9,086 | –12.0 |
| Fixed-interest periods of cover assets | Dec. 31, 2014 € million | Dec. 31, 2013 € million | Change (percent) |
|---|---|---|---|
| Mortgage Pfandbriefe | 46,456 | 45,018 | 3.2 |
| <= 6 months | 3,264 | 6,242 | –0.6 |
| > 6 months and <= 12 months | 2,942 | ||
| > 12 months and <= 18 months | 2,306 | 5,380 | –6.8 |
| > 18 months and <= 2 years | 2,707 | ||
| > 2 years and <= 3 years | 4,999 | 5,189 | –3.7 |
| > 3 years and <= 4 years | 4,706 | 4,497 | 4.6 |
| > 4 years and <= 5 years | 4,342 | 4,118 | 5.4 |
| > 5 years and <= 10 years | 15,661 | 15,144 | 3.4 |
| > 10 years | 5,529 | 4,448 | 24.3 |
| Public-sector Pfandbriefe | 36,591 | 43,941 | –16.7 |
| <= 6 months | 2,300 | 6,448 | –24.0 |
| > 6 months and <= 12 months | 2,599 | ||
| > 12 months and <= 18 months | 1,687 | 5,483 | –24.3 |
| > 18 months and <= 2 years | 2,461 | ||
| > 2 years and <= 3 years | 3,989 | 4,396 | –9.3 |
| > 3 years and <= 4 years | 2,229 | 4,275 | –47.9 |
| > 4 years and <= 5 years | 1,883 | 2,508 | –24.9 |
| > 5 years and <= 10 years | 7,665 | 8,508 | –9.9 |
| > 10 years | 11,778 | 12,323 | –4.4 |
213 properties were in forced administration at the balance sheet date (December 31, 2013: 230). The mortgage loans held as cover do not include any past-due payments (December 31, 2013: €1 million).
43.
Board of Managing Directors of the National Association of German Cooperative Banks (BVR)
Uwe Fröhlich (President)
Gerhard P. Hofmann
Dr. Andreas Martin
Berlin, June 30, 2015
National Association of German Cooperative Banks (BVR)
BVR
Board of Managing Directors
Uwe Fröhlich Gerhard P. Hofmann Dr. Andreas Martin
Bundesverband der Deutschen
Volksbanken und Raiffeisenbanken -
BVR
Schellingstraße 4 - 10785 Berlin
Telefon 030 2021-0
Heussallee 5 - 53113 Bonn
Telefon 0228 509-0
follow us:
