Consolidated Financial Statements 2016
Consolidated Financial Statements 2016
of the Volksbanken Raiffeisenbanken Cooperative Financial Network
Income statement for the period January 1 to December 31, 2016
| Note no. | 2016 € million | 2015 € million | Change (percent) | |
|---|---|---|---|---|
| Net interest income | 2. | 18,826 | 20,021 | –6.0 |
| Interest income and current income and expenses | 26,926 | 28,792 | –6.5 | |
| Interest expense | –8,100 | –8,771 | –7.7 | |
| Allowances for losses on loans and advances | 3. | –522 | –74 | >100.0 |
| Net fee and commission income | 4. | 5,963 | 5,798 | 2.8 |
| Fee and commission income | 7,313 | 7,292 | 0.3 | |
| Fee and commission expense | –1,350 | –1,494 | –9.6 | |
| Gains and losses on trading activities | 5. | 1,099 | 607 | 81.1 |
| Gains and losses on investments | 6. | 33 | –561 | >100.0 |
| Other gains and losses on valuation of financial instruments | 7. | –190 | 363 | >100.0 |
| Premiums earned | 8. | 14,658 | 14,418 | 1.7 |
| Gains and losses on investments held by insurance companies and other insurance company gains and losses | 9. | 3,783 | 3,013 | 25.6 |
| Insurance benefit payments | 10. | –15,400 | –14,664 | 5.0 |
| Insurance business operating expenses | 11. | –1,922 | –1,774 | 8.3 |
| Administrative expenses | 12. | –17,944 | –17,234 | 4.1 |
| Other net operating expense/income | 13. | –76 | –126 | –39.7 |
| Profit before taxes | 8,308 | 9,787 | –15.1 | |
| Income taxes | 14. | –2,410 | –2,820 | –14.5 |
| Net profit | 5,898 | 6,967 | –15.3 | |
Attributable to: | ||||
| Shareholders of the Cooperative Financial Network | 5,748 | 6,761 | –15.0 | |
| Non-controlling interests | 150 | 206 | –27.2 |
Statement of comprehensive income for the period January 1 to December 31, 2016
| 2016 € million | 2015 € million | Change (percent) | |
|---|---|---|---|
| Net profit | 5,898 | 6,967 | –15.3 |
| Other comprehensive income/loss | 296 | 854 | –65.3 |
| Items that maybe reclassified to the income statement | 313 | 219 | 42.9 |
| Gains and losses on available-for-sale financial assets | 336 | 103 | >100.0 |
| Gains and losses on cash flow hedges | –5 | 14 | >100.0 |
| Exchange differences on currency translation of foreign operations | 17 | 44 | –61.4 |
| Gains and losses on hedges of net investments in foreign operations | –1 | –24 | –95.8 |
| Share of other comprehensive income/loss of joint ventures and associates accounted for using the equity method | –14 | 17 | >100.0 |
| Income taxes relating to components of other comprehensive income/loss | –20 | 65 | >100.0 |
| Items that will not be reclassified to the income statement | –17 | 635 | >100.0 |
| Gains and losses arising on remeasurements of defined benefit plans | –30 | 905 | >100.0 |
| Share of other comprehensive income/loss of joint ventures and associates accounted for using the equity method | – | –1 | 100.0 |
| Income taxes relating to components of other comprehensive income/loss | 13 | –269 | >100.0 |
| Total comprehensive income | 6,194 | 7,821 | –20.8 |
Attributable to: | |||
| Shareholders of the Cooperative Financial Network | 6,027 | 7,589 | –20.6 |
| Non-controlling interests | 167 | 232 | –28.0 |
Balance sheet as at December 31, 2016
| Assets | Note no. | Dec. 31, 2016 € million | Dec. 31, 2015 € million | Change (percent) |
|---|---|---|---|---|
| Cash and cash equivalents | 15. | 25,421 | 20,536 | 23.8 |
| Loans and advances to banks | 16. | 41,433 | 32,988 | 25.6 |
| Loans and advances to customers | 16. | 733,155 | 700,608 | 4.6 |
| Allowances for losses on loans and advances | 17. | –7,520 | –7,631 | –1.5 |
| Derivatives used for hedging (positive fair values) | 18. | 1,549 | 1,050 | 47.5 |
| Financial assets held for trading | 19. | 48,270 | 53,570 | –9.9 |
| Investments | 20. | 251,965 | 249,960 | 0.8 |
| Investments held by insurance companies | 21. | 89,435 | 82,766 | 8.1 |
| Property, plant and equipment, and investment property | 22. | 11,385 | 11,168 | 1.9 |
| Income tax assets | 23. | 3,480 | 3,772 | –7.7 |
| Other assets | 24. | 17,207 | 13,732 | 25.3 |
| Total assets | 1,215,780 | 1,162,519 | 4.6 |
| Equity and liabilities | Note no. | Dec. 31, 2016 € million | Dec. 31, 2015 € million | Change (percent) |
|---|---|---|---|---|
| Deposits from banks | 25. | 103,282 | 99,505 | 3.8 |
| Deposits from customers | 25. | 774,302 | 739,218 | 4.7 |
| Debt certificates issued including bonds | 26. | 71,122 | 70,248 | 1.2 |
| Derivatives used for hedging (negative fair values) | 18. | 12,956 | 9,453 | 37.1 |
| Financial liabilities held for trading | 27. | 44,139 | 45,397 | –2.8 |
| Provisions | 28. | 13,109 | 12,563 | 4.3 |
| Insurance liabilities | 29. | 84,125 | 78,929 | 6.6 |
| Income tax liabilities | 23. | 1,056 | 1,263 | –16.4 |
| Other liabilities | 30. | 8,140 | 7,569 | 7.5 |
| Subordinated capital | 31. | 4,980 | 5,367 | –7.2 |
| Equity | 98,569 | 93,007 | 6.0 | |
| Equity of the Cooperative Financial Network | 95,886 | 90,088 | 6.4 | |
| Subscribed capital | 11,443 | 10,922 | 4.8 | |
| Capital reserves | 696 | 784 | –11.2 | |
| Retained earnings | 76,215 | 70,122 | 8.7 | |
| Revaluation reserve | 1,720 | 1,444 | 19.1 | |
| Cash flow hedge reserve | –10 | –7 | 42.9 | |
| Currency translation reserve | 74 | 62 | 19.4 | |
| Unappropriated earnings | 5,748 | 6,761 | –15.0 | |
| Non-controlling interests | 2,683 | 2,919 | –8.1 | |
| Total equity and liabilities | 1,215,780 | 1,162,519 | 4.6 |
Statement of changes in equity
€ million
| Subscribed capital | Capital reserves | Equity earned by the Cooperative Financial Network | Revaluation reserve | Cash flow hedge reserve | Currency translation reserve | Equity of the Cooperative Financial Network | Non-controlling interests | Total equity | |
|---|---|---|---|---|---|---|---|---|---|
| Equity as at Jan. 1, 2015 | 10,762 | 754 | 70,362 | 1,258 | –15 | 32 | 83,153 | 3,348 | 86,501 |
| Net profit | – | – | 6,761 | – | – | – | 6,761 | 206 | 6,967 |
| Other comprehensive income/loss | – | – | 627 | 163 | 8 | 30 | 828 | 26 | 854 |
| Total comprehensive income | – | – | 7,388 | 163 | 8 | 30 | 7,589 | 232 | 7,821 |
| Issue and repayment of equity | 160 | 30 | – | – | – | – | 190 | –248 | –58 |
| Changes in the scope of consolidation | – | – | 4 | – | – | – | 4 | 1 | 5 |
| Acquisition/disposal of non-controlling interests | – | – | –304 | 23 | – | – | –281 | –351 | –632 |
| Dividends paid | – | – | –567 | – | – | – | –567 | –63 | –630 |
| Equity as at Dec. 31, 2015 | 10,922 | 784 | 76,883 | 1,444 | –7 | 62 | 90,088 | 2,919 | 93,007 |
| Net profit | – | – | 5,748 | – | – | – | 5,748 | 150 | 5,898 |
| Other comprehensive income/loss | – | – | –10 | 279 | –3 | 13 | 279 | 17 | 296 |
| Total comprehensive income | – | – | 5,738 | 279 | –3 | 13 | 6,027 | 167 | 6,194 |
| Issue and repayment of equity | 521 | –88 | – | – | – | – | 433 | 226 | 659 |
| Changes in the scope of consolidation | – | – | –2 | 1 | – | – | –1 | –2 | –3 |
| Acquisition/disposal of non-controlling interests | – | – | –127 | –4 | – | –1 | –132 | –579 | –711 |
| Dividends paid | – | – | –529 | – | – | – | –529 | –48 | –577 |
| Equity as at Dec. 31, 2016 | 11,443 | 696 | 81,963 | 1,720 | –10 | 74 | 95,886 | 2,683 | 98,569 |
| Breakdown of subscribed capital | Dec. 31, 2016 € million | Dec. 31, 2015 € million | Change (percent) |
|---|---|---|---|
| Cooperative shares | 11,220 | 10,673 | 5.1 |
| Share capital | 138 | 144 | –4.2 |
| Capital of silent partners | 85 | 105 | –19.0 |
| Total | 11,443 | 10,922 | 4.8 |
Statement of cash flows
| 2016 € million | 2015 € million | |
|---|---|---|
| Net profit | 5,898 | 6,967 |
| Non-cash items included in net profit and reconciliation to cash flows from operating activities | ||
| Depreciation, amortization, impairment losses, and reversal of impairment losses on assets, and other non-cash changes in financial assets and liabilities | –1,747 | 451 |
| Non-cash changes in provisions | 546 | –1,102 |
| Changes in insurance liabilities | 8,493 | 7,262 |
| Other non-cash income and expenses | 66 | 366 |
| Gains and losses on the disposal of assets and liabilities | –78 | 476 |
| Other adjustments (net) | –16,614 | –18,213 |
| Subtotal | –3,436 | –3,793 |
| Cash changes in assets and liabilities arising from operating activities | ||
| Loans and advances to banks and customers | –41,478 | –26,402 |
| Other assets from operating activities | –863 | 350 |
| Derivatives used for hedging (positive and negative fair values) | 441 | –835 |
| Financial assets and financial liabilities held for trading | 5,159 | –748 |
| Deposits from banks and customers | 39,260 | 21,475 |
| Debt certificates including bonds | 753 | 3,132 |
| Other liabilities from operating activities | –2,611 | –3,145 |
| Interest, dividends and operating lease payments received | 27,825 | 31,997 |
| Interest paid | –8,500 | –7,153 |
| Income taxes paid | –1,642 | –1,897 |
| Cash flows from operating activities | 14,908 | 12,981 |
| Proceeds from the sale of investments | 34,670 | 6,742 |
| Proceeds from the sale of investments held by insurance companies | 20,330 | 18,764 |
| Payments for acquisitions of investments | –37,296 | –8,625 |
| Payments for acquisitions of investments held by insurance companies | –25,613 | –23,673 |
The consolidated statement of cash flows shows the changes in cash and cash equivalents during the financial year. Cash and cash equivalents consist of cash on hand, balances with central banks and other government institutions as well as treasury bills and non-interest bearing treasury notes. Cash and cash equivalents do not include any financial investments with a maturity of more than three months at the date of acquisition. Changes in cash and cash equivalents are broken down into operating, investing and financing activities.
| 2016 € million | 2015 € million | |
|---|---|---|
| Net payments for acquisitions of property, plant and equipment, and investment property (excl. assets subject to operating leases) | –1,222 | –1,433 |
| Net payments for acquisitions of intangible non-current assets | –73 | –15 |
| Changes in the scope of consolidation | 21 | –13 |
| Cash flows from investing activities | –9,183 | –8,253 |
| Proceeds from capital increases by shareholders of the Cooperative Financial Network | 433 | 190 |
| Proceeds from capital increases by non-controlling interests | 226 | – |
| Dividends paid to shareholders of the Cooperative Financial Network | –529 | –567 |
| Dividends paid to non-controlling interests | –48 | –63 |
| Other payments to non-controlling interests | – | –248 |
| Net change in cash and cash equivalents from other financing activities (including subordinated capital) | –922 | 840 |
| Cash flows from financing activities | –840 | 152 |
| Cash and cash equivalents as at January 1 | 20,536 | 15,656 |
| Cash flows from operating activities | 14,908 | 12,981 |
| Cash flows from investing activities | –9,183 | –8,253 |
| Cash flows from financing activities | –840 | 152 |
| Cash and cash equivalents as at December 31 | 25,421 | 20,536 |
Cash flows from operating activities comprise cash flows mainly arising in connection with the revenue-generating activities of the Cooperative Financial Network or other activities that cannot be classified as investing or financing activities. Cash flows related to the acquisition and sale of non-current assets are allocated to investing activities. Cash flows from financing activities include cash flows arising from transactions with equity owners and from other borrowings to finance business activities.
Notes to the consolidated financial statements
A General information
Explanatory information on the consolidated financial statements
The consolidated financial statements of the Volksbanken Raiffeisenbanken Cooperative Financial Network prepared by the National Association of German Cooperative Banks (BVR) are based on the significant financial reporting principles set out in the annex. The cooperative shares and share capital of the local cooperative banks are held by their members. The local cooperative banks own the share capital of the central institution either directly or through intermediate holding companies. The Cooperative Financial Network does not qualify as a corporate group as defined by the International Financial Reporting Standards (IFRS), the German Commercial Code (HGB) or the German Stock Corporation Act (AktG).
These consolidated financial statements have been prepared for informational purposes and to present the business development and performance of the Cooperative Financial Network, which is treated as a single economic entity in terms of its risks and strategies. In addition, the financial statements were prepared in compliance with the provisions set out in article 113(7)(e) of Regulation (EU) No. 575/2013 of the European Parliament and of the Council of June 26, 2013 on prudential requirements for credit institutions and investment firms and amending Regulation (EU) No. 648/2012 (Capital Requirements Regulation – CRR). These consolidated financial statements are not a substitute for analysis of the consolidated entities’ financial statements.
The underlying data presented in these consolidated financial statements is provided by the separate and consolidated financial statements of the entities in the Cooperative Financial Network and also includes data from supplementary surveys of the local cooperative banks. The consolidated financial statements of DZ BANK included in these consolidated financial statements have been prepared on the basis of IFRS as adopted by the European Union.
The financial year corresponds to the calendar year. The consolidated subsidiaries have generally prepared their financial statements on the basis of the financial year ended December 31, 2016. There is one subsidiary (2015: 1 subsidiary) included in the consolidated financial statements with a different reporting date for its annual financial statements. With 42 exceptions (2015: 25 exceptions), the separate financial statements of the entities accounted for using the equity method are prepared using the same balance sheet date as that of the consolidated financial statements.
In the interest of clarity, some items on the face of the balance sheet and the income statement have been aggregated and are explained by additional disclosures.
Information regarding significant financial reporting principles can be found in the annex to the consolidated financial statements.
Scope of consolidation
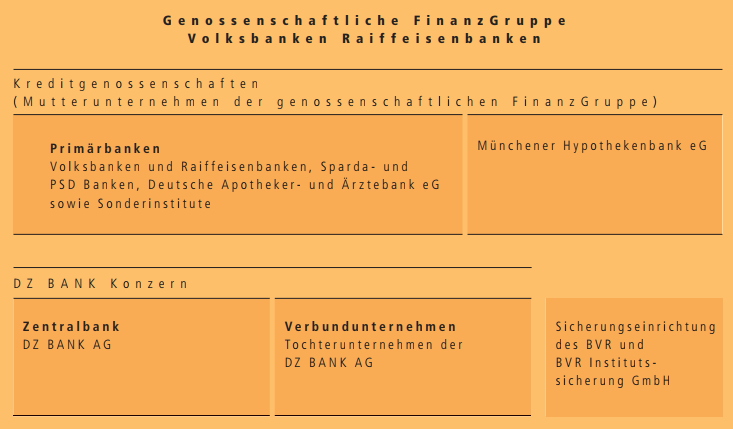
The consolidated entities included in these consolidated financial statements are 972 primary banks (2015: 1,018), the DZ BANK Group, Münchener Hypothekenbank eG (MHB), the BVR protection scheme, and BVR Institutssicherung GmbH. The consolidated primary banks include Deutsche Apotheker- und Ärztebank eG, the Sparda banks, the PSD banks, and specialized institutions such as BAG Bankaktiengesellschaft. In the previous year as well as until the merger date, the WGZ BANK Group was included in the consolidated financial statements. As a result of the business combination of DZ BANK AG and WGZ BANK AG, the WGZ BANK Group was merged into the DZ BANK Group. This business combination had no impact on the scope of consolidation in the consolidated financial statements.
The primary banks and MHB are the legally independent, horizontally structured parent entities of the Cooperative Financial Network, whereas the other companies and the DZ BANK Group are consolidated as subsidiaries. The cooperative central institution and a total of 476 subsidiaries (2015: 570, together with the WGZ BANK Group) have been consolidated in the DZ BANK Group. Further information on the shareholdings can be found in the list of shareholdings included in the annual report of the DZ BANK Group.
The consolidated financial statements include 22 joint ventures between a consolidated entity and at least one other non-network entity (2015: 24) and 37 associates (2015: 31) over which a consolidated entity has significant influence, which are accounted for using the equity method.
B Selected disclosures of interests in other entities
Investments in subsidaries
Share in the business operations of the Cooperative Financial Network attributable to non-controlling interests
DZ BANK AG Deutsche Zentral-Genossenschaftsbank (DZ BANK) is included in the consolidated financial statements together with its respective subsidiaries as a subgroup. In the prior year, Westdeutsche Genossenschafts-Zentralbank AG (WGZ BANK) was also included in the consolidated financial statements together with its subsidiaries as a subgroup. In the year under review, WGZ BANK was merged with DZ BANK. DZ BANK is focused on its customers and owners, the local cooperative banks, as central institution, commercial bank and holding company. The objective of this focus is to sustainably expand the position of the Cooperative Financial Network as one of the leading bancassurance groups.
The shares of DZ BANK, with its headquarters in Frankfurt/Main, Germany, are held by the primary banks and by MHB, with ownership interests amounting to 94.6 percent (2015: 86.2 percent). Another 6.7 percent of the shares were held by WGZ BANK in the previous year. The remaining shares of 5.4 percent (2015: 7.1 percent) are attributable to shareholders that are not part of the Cooperative Financial Network. The pro-rata share in net profit attributable to non-controlling interests amounts to €150 million (2015: €191 million). The carrying amount of non-controlling interests amounts to €2,683 million (2015: €2,836 million). In the financial year under review, the dividend payment made to non-controlling interests amounts to €48 million (2015: €62 million).
In the prior year, the shares of WGZ BANK, with its headquarters in Düsseldorf, Germany, were held by the primary banks with ownership interests amounting to 98.1 percent. The remaining shares of 1.9 percent were attributable to shareholders that were not part of the Cooperative Financial Network. The pro-rata share in net profit attributable to non-controlling interests amounted to €15 million. The carrying amount of non-controlling interests amounted to €83 million. In the prior year, the dividend payment made to non-controlling interests amounted to €1 million.
Nature and extent of significant limitations
National regulatory requirements, contractual provisions, and provisions of company law restrict the ability of the DZ BANK Group companies included in the consolidated financial statements to transfer assets within the group. Where restrictions can be specifically assigned to individual line items on the balance sheet, the carrying amounts of the assets subject to restrictions on the balance sheet date are shown in the following table:
| Dec. 31, 2016 € million | Dec. 31, 2015 € million | Change (percent) | |
|---|---|---|---|
| Assets | 78,322 | 74,732 | 4.8 |
| Loans and advances to customers | 3,345 | 4,174 | –19.9 |
| Investments | 308 | – | – |
| Investments held by insurance companies | 74,665 | 70,552 | 5.8 |
| Other assets | 4 | 6 | –33.3 |
| Liabilities | 126,234 | 119,148 | 5.9 |
| Deposits from banks | 1,903 | 1,690 | 12.6 |
| Deposits from customers | 53,771 | 50,926 | 5.6 |
| Provisions | 915 | 653 | 40.1 |
| Insurance liabilities | 69,645 | 65,879 | 5.7 |
Nature of the risks associated with interests in consolidated structured entities
Risks arising from interests in consolidated structured entities largely result from loans to fully consolidated funds within the DZ BANK Group, some of which are extended in the form of junior loans.
Interests in joint arrangements and Investments in associates
Nature, extent and financial effects of interests in joint arrangements
The carrying amount of individually immaterial joint ventures accounted for using the equity method totaled €540 million as at the balance sheet date (2015: €564 million).
Aggregated financial information for joint ventures accounted for using the equity method that individually is not material:
| 2016 € million | 2015 € million | Change (percent) | |
|---|---|---|---|
| Share of profit from continuing operations | 109 | 110 | –0.9 |
| Share of other comprehensive income/loss | –14 | 24 | >100.0 |
| Share of total comprehensive income | 95 | 134 | –29.1 |
Nature, extent and financial effects of interests in associates
The carrying amount of individually immaterial associates accounted for using the equity method totaled €349 million as at the balance sheet date (2015: €410 million).
Aggregated financial information for associates accounted for using the equity method that individually is not material:
| 2016 € million | 2015 € million | Change (percent) | |
|---|---|---|---|
| Share of profit from continuing operations | 18 | 17 | 5.9 |
| Share of profit/loss from discontinued operations | – | 1 | –100.0 |
| Share of other comprehensive income/loss | – | 22 | –100.0 |
| Share of total comprehensive income | 18 | 40 | –55.0 |
Interests in unconsolidated structured entities
Structured entities are entities that have been designed so that voting rights or similar rights are not the dominant factor in deciding who controls the entity. The Cooperative Financial Network mainly distinguishes between the following types of interests in unconsolidated structured entities, based on their design and the related risks; these entities largely concern companies of the DZ BANK Group:
- Interests in investment funds issued by the Cooperative Financial Network
- Interests in investment funds not issued by the Cooperative Financial Network
- Interests in securitization vehicles
- Interests in asset-leasing vehicles
Interests in investment funds issued by the Cooperative Financial Network
The interests in the investment funds issued by the Cooperative Financial Network largely comprise investment funds issued by entities in the Union Investment Group in accordance with the contractual form model without voting rights and, to a lesser extent, those that are structured as a company with a separate legal personality. Furthermore, the DVB Bank Group makes subordinated loans available to fully consolidated funds for the purpose of transport finance. In turn, these funds make subordinated loans or direct equity investments available to unconsolidated entities.
The maximum exposure of the investment funds issued and managed by the Cooperative Financial Network is determined as a gross value, excluding deduction of available collateral, and amounts to €10,628 million as at the reporting date (2015: €10,331 million). These investment fund assets resulted in losses of €22 million (2015: losses of €15 million) as well as income of €1,670 million (2015: €1,636 million).
Interests in investment funds not issued by the Cooperative Financial Network
The interests in the investment funds not issued by the Cooperative Financial Network above all comprise investment funds managed by entities in the Union Investment Group within the scope of their own decision-making powers that have been issued by entities outside the Cooperative Financial Network and parts of such investment funds. Their total volume amounted to €32,059 million (2015: €27,269 million). Moreover, loans to investment funds are extended in order to generate interest income. In addition, there are investment funds issued by entities outside the Cooperative Financial Network in connection with unit-linked life insurance of the R+V Group (R+V) amounting to €7,031 million (2015: €7,351 million) that, however, do not result in a maximum exposure.
The maximum exposure arising of the investment funds not issued by the Cooperative Financial Network is determined as a gross value, excluding deduction of available collateral, and amounts to €2,511 million as at the reporting date (2015: €2,095 million). Income generated from these investment fund assets in the financial year 2016 amounted to €111 million (2015: €108 million).
Interests in securitization vehicles
The interests in securitization vehicles are interests in vehicles where the Cooperative Financial Network involvement goes beyond that of an investor.
The material interests in securitization vehicles comprise the two multi-seller asset-backed commercial paper programs: CORAL and AUTOBAHN. DZ BANK acts as sponsor and program agent for both programs. It is also the program administrator for AUTOBAHN.
The maximum exposure of the interests in securitization vehicles in the Cooperative Financial Network is determined as a gross value, excluding deduction of available collateral, and amounts to €4,380 million as at the reporting date (2015: €3,459 million). Income generated from these interests in the financial year 2016 amounted to €64 million (2015: €84 million).
Interests in asset-leasing vehicles
The interests in asset-leasing vehicles comprise shares in limited partnerships and voting rights, other than the shares in limited partnerships established by VR LEASING for the purpose of real estate leasing (asset-leasing vehicles), in which the asset, and the funding occasionally provided by the DZ BANK Group, are placed.
The actual maximum exposure of the interests in asset-leasing vehicles in the Cooperative Financial Network is determined as a gross value, excluding deduction of available collateral, and amounts to €-12 million (2015: €1 million) as at the reporting date. Interest income and current income and expense generated from these interests in the financial year 2016 amounted to €4 million (2015: €5 million).
C Income statement disclosures
| 1. Information on operating segments Financial year 2016 € million | Bank | Retail | Real Estate Finance | Insurance | Other/Consolidation | Total |
|---|---|---|---|---|---|---|
| Net interest income | 1,623 | 16,618 | 1,322 | – | –737 | 18,826 |
| Allowances for losses on loans and advances | –523 | –51 | 45 | – | 7 | –522 |
| Net fee and commission income | 603 | 6,034 | –152 | – | –522 | 5,963 |
| Gains and losses on trading activities | 851 | 211 | – | – | 37 | 1,099 |
| Gains and losses on investments | 77 | –94 | 36 | – | 14 | 33 |
| Other gains and losses on valuation of financial instruments | –106 | –10 | –46 | – | –28 | –190 |
| Premiums earned | – | – | – | 14,658 | – | 14,658 |
| Gains and losses on investments held by insurance companies and other insurance company gains and losses | – | – | – | 3,885 | –102 | 3,783 |
| Insurance benefit payments | – | – | – | –15,400 | – | –15,400 |
| Insurance business operating expenses | – | – | – | –2,454 | 532 | –1,922 |
| Administrative expenses | –2,059 | –15,276 | –754 | – | 145 | –17,944 |
| Other net operating expense/income | –42 | –235 | 41 | –8 | 168 | –76 |
| Profit/loss before taxes | 424 | 7,197 | 492 | 681 | –486 | 8,308 |
| Cost/income ratio (percent) | 68.5 | 67.8 | 62.8 | – | – | 67.0 |
| Financial year 2015 € million | Bank | Retail | Real Estate Finance | Insurance | Other/Consolidation | Total |
|---|---|---|---|---|---|---|
| Net interest income | 2,017 | 17,260 | 1,593 | – | –849 | 20,021 |
| Allowances for losses on loans and advances | –94 | –7 | 27 | – | – | –74 |
| Net fee and commission income | 586 | 5,911 | –193 | – | –506 | 5,798 |
| Gains and losses on trading activities | 458 | 189 | –19 | – | –21 | 607 |
| Gains and losses on investments | 110 | –611 | –53 | – | –7 | –561 |
| Other gains and losses on valuation of financial instruments | 7 | –6 | 364 | – | –2 | 363 |
| Premiums earned | – | – | – | 14,418 | – | 14,418 |
| Gains and losses on investments held by insurance companies and other insurance company gains and losses | – | – | – | 3,132 | –119 | 3,013 |
| Insurance benefit payments | – | – | – | –14,664 | – | –14,664 |
| Insurance business operating expenses | – | – | – | –2,287 | 513 | –1,774 |
| Administrative expenses | –1,830 | –15,119 | –700 | – | 415 | –17,234 |
| Other net operating expense/income | –98 | –68 | 31 | 26 | –17 | –126 |
| Profit/loss before taxes | 1,156 | 7,549 | 1,050 | 625 | –593 | 9,787 |
| Cost/income ratio (percent) | 59.4 | 66.7 | 40.6 | – | – | 63.6 |
Definition of operating segments
The Volksbanken Raiffeisenbanken Cooperative Financial Network is founded on the underlying principle of decentralization. It is based on the local primary banks, whose business activities are supported by the central institution – DZ BANK – and by specialized service providers within the cooperative sector. These specialized service providers are integrated into the central institution. The main benefit derived by the primary banks from their collaboration with these specialized services providers and the central institution is that they can offer a full range of financial products and services.
The Bank operating segment combines the activities of the Cooperative Financial Network in the corporate customers, institutional customers and capital markets businesses. The operating segment focuses on corporate customers. It essentially comprises DZ BANK, the VR LEASING Group and DVB Bank Group.
The Retail operating segment covers private banking and activities relating to asset management. The segment focuses on retail clients. It mainly includes primary banks as well as the DZ PRIVATBANK, TeamBank AG Nürnberg (TeamBank) and Union Investment Group.
The Real Estate Finance operating segment encompasses the home savings and loan operations, mortgage banking, and real estate business. The entities allocated to this operating segment include Bausparkasse Schwäbisch Hall Group (BSH), Deutsche Genossenschafts-Hypothekenbank AG, WL BANK AG Westfälische Landschaft Bodenkreditbank, and MHB.
Insurance operations are reported under the Insurance operating segment. This operating segment consists solely of R+V.
Other/Consolidation contains the BVR protection scheme as well as BVR Institutssicherung GmbH (BVR-ISG), whose task is to avert impending or existing financial difficulties faced by member institutions by taking preventive action or implementing restructuring measures. This operating segment also includes intersegment consolidation items.
Presentation of the disclosures on operating segments
The information on operating segments presents the interest income generated by the operating segments and the associated interest expenses on a netted basis as net interest income.
Intersegment consolidation
The adjustments to the figure for net interest income resulted largely from the consolidation of dividends paid within the Cooperative Financial Network.
The figure under Other/Consolidation for net fee and commission income relates specifically to the fee and commission business transacted between the primary banks, TeamBank, BSH, and R+V.
The figure under Other/Consolidation for administrative expenses includes the contributions paid to BVR-SE and BVR-ISG by member institutions of the Cooperative Financial Network.
The remaining adjustments are largely attributable to the consolidation of income and expenses.
| 2. Net interest income | 2016 € million | 2015 € million | Change (percent) |
|---|---|---|---|
| Interest income and current income and expense | 26,926 | 28,792 | –6.5 |
| Interest income from | 27,396 | 29,307 | –6.5 |
| Lending and money market business | 23,253 | 24,307 | –4.3 |
| of which: Building society operations | 1,036 | 1,031 | 0.5 |
| Finance leases | 150 | 184 | –18.5 |
| Fixed-income securities | 3,139 | 3,646 | –13.9 |
| Other assets | –566 | –538 | 5.2 |
| Financial assets with a negative effective interest rate | –74 | –19 | >100.0 |
| Current income from | 1,061 | 1,267 | –16.3 |
| Shares and other variable-yield securities | 947 | 1,023 | –7.4 |
| Investments in subsidiaries and equity investments | 135 | 264 | –48.9 |
| Operating leases | –21 | –20 | 5.0 |
| Income/loss from using the equity method for | 31 | 48 | –35.4 |
| Investments in joint ventures | 17 | 41 | –58.5 |
| Investments in associates | 14 | 7 | 100.0 |
| Income from profit-pooling, profit-transfer and partial profit-transfer agreements | 82 | 81 | 1.2 |
| Interest expense | –8,100 | –8,771 | –7.7 |
| Interest expense on | –7,811 | –8,506 | –8.2 |
| Deposits from banks and customers | –6,258 | –6,424 | –2.6 |
| of which: building society operations | –959 | –820 | 17.0 |
| Debt certificates issued including bonds | –1,384 | –1,887 | –26.7 |
| Subordinated capital | –254 | –241 | 5.4 |
| Other liabilities | 12 | 19 | –36.8 |
| Financial liabilities with a positive effective interest rate | 73 | 27 | >100.0 |
| Other interest expense | –289 | –265 | 9.1 |
| Total | 18,826 | 20,021 | –6.0 |
The interest income from other assets and the interest expense on other liabilities result from gains and losses on the amortization of fair value changes of the hedged items in portfolio hedges of interest-rate risk. Owing to the current low level of interest rates in the money markets and capital markets, there may be a negative effective interest rate for financial assets and a positive effective interest rate for financial liabilities.
| 3. Allowances for losses on loans and advances | 2016 € million | 2015 € million | Change (percent) |
|---|---|---|---|
| Additions | –2,337 | –2,143 | –9.1 |
| Reversals | 1,747 | 1,906 | –8.3 |
| Directly recognized impairment losses | –148 | –167 | –11.4 |
| Recoveries from loans and advances previously impaired | 277 | 318 | –12.9 |
| Changes in the provisions for loans and advances as well as in the liabilities from financial guarantee contracts | -54 | 12 | >100.0 |
| Impairment losses on loans and advances available for sale | –7 | – | – |
| Total | –522 | –74 | >100.0 |
| 4. Net fee and commission income | 2016 € million | 2015 € million | Change (percent) |
|---|---|---|---|
| Fee and commission income | 7,313 | 7,292 | 0.3 |
| Securities business | 3,203 | 3,278 | –2.3 |
| Asset management | 332 | 346 | –4.0 |
| Payments processing including card processing | 2,481 | 2,398 | 3.5 |
| Lending business and trust activities | 246 | 262 | –6.1 |
| Financial guarantee contracts and loan commitments | 182 | 181 | 0.6 |
| Foreign commercial business | 125 | 134 | –6.7 |
| Building society operations | 11 | 5 | >100.0 |
| Other | 733 | 688 | 6.5 |
| Fee and commission expense | –1,350 | –1,494 | –9.6 |
| Securities business | –499 | –491 | –8.6 |
| Asset management | –104 | –116 | –10.3 |
| Payments processing including card processing | –285 | –284 | 0.4 |
| Lending business and trust activities | –80 | –165 | –51.5 |
| Financial guarantee contracts and loan commitments | –13 | 51 | >100.0 |
| Foreign commercial business | –25 | –28 | –10.7 |
| Building society operations | –81 | –103 | –21.4 |
| Other | –313 | –358 | –12.6 |
| Total | 5,963 | 5,798 | 2.8 |
| 5. Gains and losses on trading activities | 2016 € million | 2015 € million | Change (percent) |
|---|---|---|---|
| Gains and losses on trading in financial instruments | 528 | 287 | 84.0 |
| Gains and losses on trading in foreign exchange, foreign notes and coins, and precious metals | 385 | 135 | >100.0 |
| Gains and losses on commodities trading | 186 | 185 | 0.5 |
| Total | 1,099 | 607 | 81.1 |
| 6. Gains and losses on investments | 2016 € million | 2015 € million | Change (percent) |
|---|---|---|---|
| Gains and losses from securities | –61 | –636 | –90.4 |
| Gains and losses from investments in subsidiaries and equity investments | 94 | 75 | 25.3 |
| Total | 33 | –561 | >100.0 |
| 7. Other gains and losses on valuation of financial instruments | 2016 € million | 2015 € million | Change (percent) |
|---|---|---|---|
| Gains and losses from hedge accounting | –42 | 31 | >100.0 |
| Fair value hedges | –42 | 31 | >100.0 |
| Gains and losses on hedging instruments | –2,856 | 1,895 | >100.0 |
| Gains and losses on hedged items | 2,814 | –1,864 | >100.0 |
| Gains and losses on derivatives held for purposes other than trading | 18 | –86 | >100.0 |
| Gains and losses on financial instruments designated as at fair value through profit or loss | –166 | 418 | >100.0 |
| Total | –190 | 363 | >100.0 |
| 8. Premiums earned | 2016 € million | 2015 € million | Change (percent) |
|---|---|---|---|
| Net premiums written | 14,668 | 14,442 | 1.6 |
| Gross premiums written | 14,767 | 14,536 | 1.6 |
| Reinsurance premiums ceded | –99 | –94 | 5.3 |
| Change in provision for unearned premiums | –10 | –24 | –58.3 |
| Gross premiums | –8 | –26 | –69.2 |
| Reinsurers’ share | –2 | 2 | >100.0 |
| Total | 14,658 | 14,418 | 1.7 |
| 9. Gains and losses on investments held by insurance companies and other insurance company gains and losses | 2016 € million | 2015 € million | Change (percent) |
|---|---|---|---|
| Interest income and current income | 2,534 | 2,575 | –1.6 |
| Administrative expenses | –132 | –115 | 14.8 |
| Gains and losses on valuation and disposals | 1,244 | 478 | >100.0 |
| Other gains and losses of insurance companies | 137 | 75 | 82.7 |
| Total | 3,783 | 3,013 | 25.6 |
| 10. Insurance benefit payments | 2016 € million | 2015 € million | Change (percent) |
|---|---|---|---|
| Expenses for claims | –10,601 | –9,850 | 7.6 |
| Gross expenses for claims | –10,670 | –9,890 | 7.9 |
| Reinsurers’ share | 69 | 40 | 72.5 |
| Changes in benefit reserve, reserve for premium refunds, and in other insurance liabilities | –4,799 | –4,814 | –0.3 |
| Changes in gross provisions | –4,796 | –4,808 | –0.2 |
| Reinsurers’ share | –3 | –6 | –50.0 |
| Total | –15,400 | –14,664 | 5.0 |
Claims rate trend for direct non-life insurance business including claim settlement costs
Gross claims provisions in direct business and payments made against the original provisions:
| € million | 2016 | 2015 | 2014 | 2013 | 2012 | 2011 | 2010 | 2009 | 2008 | 2007 | 2006 |
|---|---|---|---|---|---|---|---|---|---|---|---|
| At the end of the year | 4,173 | 3,856 | 3,634 | 3,901 | 3,345 | 3,341 | 3,324 | 2,953 | 2,704 | 2,672 | 2,509 |
| 1 year later | – | 3,767 | 3,523 | 3,847 | 3,336 | 3,359 | 3,135 | 2,901 | 2,623 | 2,601 | 2,414 |
| 2 years later | – | – | 3,457 | 3,769 | 3,247 | 3,279 | 3,160 | 2,763 | 2,527 | 2,531 | 2,306 |
| 3 years later | – | – | – | 3,731 | 3,220 | 3,254 | 3,139 | 2,756 | 2,533 | 2,472 | 2,268 |
| 4 years later | – | – | – | – | 3,189 | 3,241 | 3,122 | 2,756 | 2,505 | 2,487 | 2,230 |
| 5 years later | – | – | – | – | – | 3,250 | 3,139 | 2,768 | 2,513 | 2,478 | 2,245 |
| 6 years later | – | – | – | – | – | – | 3,080 | 2,710 | 2,469 | 2,434 | 2,214 |
| 7 years later | – | – | – | – | – | – | – | 2,685 | 2,466 | 2,422 | 2,210 |
| 8 years later | – | – | – | – | – | – | – | – | 2,449 | 2,426 | 2,205 |
| 9 years later | – | – | – | – | – | – | – | – | – | 2,419 | 2,207 |
| 10 years later | – | – | – | – | – | – | – | – | – | – | 2,207 |
| Settlements | – | 89 | 177 | 170 | 156 | 91 | 244 | 268 | 255 | 253 | 302 |
Net claims provisions in direct business and payments made against the original provisions:
| € million | 2016 | 2015 | 2014 | 2013 | 2012 | 2011 | 2010 |
|---|---|---|---|---|---|---|---|
| At the end of the year | 4,110 | 3,827 | 3,574 | 3,669 | 3,313 | 3,298 | 3,254 |
| 1 year later | – | 3,736 | 3,460 | 3,613 | 3,300 | 3,317 | 3,056 |
| 2 years later | – | – | 3,393 | 3,533 | 3,211 | 3,236 | 3,077 |
| 3 years later | – | – | – | 3,490 | 3,180 | 3,208 | 3,057 |
| 4 years later | – | – | – | – | 3,139 | 3,194 | 2,939 |
| 5 years later | – | – | – | – | – | 3,191 | 3,049 |
| 6 years later | – | – | – | – | – | – | 2,957 |
| Settlements | – | 91 | 181 | 179 | 174 | 107 | 297 |
Claims rate trend for inward reinsurance business
Gross claims provisions in inward reinsurance business and payments made against the original provisions:
| € million | 2016 | 2015 | 2014 | 2013 | 2012 | 2011 | 2010 | 2009 | 2008 | 2007 | 2006 |
|---|---|---|---|---|---|---|---|---|---|---|---|
| Gross provisions for claims outstanding | 2,718 | 2,433 | 1,976 | 1,710 | 1,506 | 1,409 | 1,190 | 892 | 712 | 596 | 524 |
| Cumulative payments for the year concerned and prior years | |||||||||||
| 1 year later | – | 622 | 464 | 481 | 385 | 463 | 437 | 282 | 232 | 127 | 138 |
| 2 years later | – | – | 783 | 685 | 630 | 640 | 632 | 399 | 347 | 203 | 175 |
| 3 years later | – | – | – | 897 | 764 | 345 | 739 | 468 | 410 | 250 | 212 |
| 4 years later | – | – | – | – | 930 | 891 | 856 | 516 | 447 | 282 | 240 |
| 5 years later | – | – | – | – | – | 1,029 | 922 | 588 | 475 | 307 | 252 |
| 6 years later | – | – | – | – | – | – | 1,043 | 626 | 528 | 324 | 266 |
| 7 years later | – | – | – | – | – | – | – | 652 | 555 | 366 | 283 |
| 8 years later | – | – | – | – | – | – | – | – | 574 | 384 | 307 |
| 9 years later | – | – | – | – | – | – | – | – | – | 396 | 321 |
| 10 years later | – | – | – | – | – | – | – | – | – | – | 330 |
| Gross provisions for claims outstanding and payments made against the original provision | |||||||||||
| At the end of the year | 2,718 | 2,433 | 1,976 | 1,710 | 1,506 | 1,409 | 1,190 | 892 | 712 | 596 | 524 |
| 1 year later | – | 2,434 | 2,157 | 1,840 | 1,593 | 1,536 | 1,401 | 1,026 | 779 | 583 | 541 |
| 2 years later | – | – | 2,004 | 1,859 | 1,569 | 1,472 | 1,343 | 872 | 765 | 529 | 480 |
| 3 years later | – | – | – | 1,779 | 1,628 | 1,014 | 1,338 | 826 | 696 | 518 | 432 |
| 4 years later | – | – | – | – | 1,580 | 1,528 | 1,360 | 837 | 680 | 479 | 423 |
| 5 years later | – | – | – | – | – | 1,501 | 1,396 | 858 | 691 | 470 | 396 |
| 6 years later | – | – | – | – | – | – | 1,379 | 870 | 709 | 480 | 391 |
| 7 years later | – | – | – | – | – | – | – | 876 | 719 | 498 | 399 |
| 8 years later | – | – | – | – | – | – | – | – | 725 | 504 | 403 |
| 9 years later | – | – | – | – | – | – | – | – | – | 505 | 407 |
| 10 years later | – | – | – | – | – | – | – | – | – | – | 407 |
| Settlements | – | –1 | –28 | –69 | –74 | –92 | –189 | 16 | –13 | 91 | 117 |
Net claims provisions in inward reinsurance business and payments made against the original provisions:
| € million | 2016 | 2015 | 2014 | 2013 | 2012 | 2011 | 2010 |
|---|---|---|---|---|---|---|---|
| Net provisions for claims outstanding | 2,710 | 2,428 | 1,970 | 1,695 | 1,491 | 1,389 | 1,164 |
| Cumulative payments for the year concerned and prior years | |||||||
| 1 year later | – | 622 | 464 | 473 | 383 | 461 | 432 |
| 2 years later | – | – | 782 | 677 | 620 | 636 | 625 |
| 3 years later | – | – | – | 888 | 754 | 333 | 729 |
| 4 years later | – | – | – | – | 919 | 878 | 839 |
| 5 years later | – | – | – | – | – | 1,016 | 904 |
| 6 years later | – | – | – | – | – | – | 1,025 |
| Net provisions for claims outstanding and payments made against the original provision | |||||||
| At the end of the year | 2,710 | 2,428 | 1,970 | 1,695 | 1,491 | 1,389 | 1,164 |
| 1 year later | – | 2,429 | 2,152 | 1,827 | 1,576 | 1,519 | 1,377 |
| 2 years later | – | – | 1,999 | 1,845 | 1,554 | 1,454 | 1,321 |
| 3 years later | – | – | – | 1,766 | 1,612 | 997 | 1,314 |
| 4 years later | – | – | – | – | 1,566 | 1,510 | 1,337 |
| 5 years later | – | – | – | – | – | 1,484 | 1,372 |
| 6 years later | – | – | – | – | – | – | 1,357 |
| Settlements | – | –1 | –29 | –71 | –75 | –95 | –193 |
| 11. Insurance business operating expenses | 2016 € million | 2015 € million | Change (percent) |
|---|---|---|---|
| Gross expenses | –1,944 | –1,794 | 8.4 |
| Reinsurers’ share | 22 | 20 | 10.0 |
| Total | –1,922 | –1,774 | 8.3 |
| 12. Administrative expenses | 2016 € million | 2015 € million | Change (percent) |
|---|---|---|---|
| Staff expenses | –10,318 | –10,160 | 1.6 |
| General and administrative expenses | –6,679 | –6,141 | 8.8 |
| Depreciation/amortization and impairment losses | –947 | –933 | 1.5 |
| Total | –17,944 | –17,234 | 4.1 |
| 13. Other net operating expense/income | 2016 € million | 2015 € million | Change (percent) |
|---|---|---|---|
| Gains and losses on non-current assets classified as held for sale and disposal groups | 83 | 39 | >100,0 |
| Other operating income | 816 | 868 | –6.0 |
| Other operating expenses | –975 | –1,033 | –5.6 |
| Total | –76 | –126 | –39.7 |
| 14. Income taxes | 2016 € million | 2015 € million | Change (percent) |
|---|---|---|---|
| Current tax expense | –2,497 | –2,680 | –6.8 |
| Income from/expense on deferred taxes | 87 | –140 | >100.0 |
| Total | –2,410 | –2,820 | –14.5 |
Current taxes in relation to the German limited companies are calculated using an effective corporation tax rate of 15.825 percent based on a corporation tax rate of 15.0 percent plus the solidarity surcharge. The effective rate for trade tax is 14.0 percent based on an average trade tax multiplier of 400 percent. The tax rates correspond to those for the previous year.
Deferred taxes must be calculated using tax rates expected to apply when the tax asset or liability arises. The tax rates used are therefore those that are valid or have been announced for the periods in question as at the balance sheet date.
| 2016 € million | 2015 € million | Change (percent) | |
|---|---|---|---|
| Profit before taxes | 8,308 | 9,787 | –15.1 |
| Notional rate of income tax of the Cooperative Financial Network (percent) | 29,825 | 29,825 | |
| Income taxes based on notional rate of income tax | –2,478 | –2,919 | –15.1 |
| Tax effects | 68 | 99 | –31.3 |
| Tax effects of tax-exempt income and non-tax deductible expenses | 312 | 233 | 33.9 |
| Tax effects of different tax types, different trade tax multipliers, and changes in tax rates | 8 | 5 | 60.0 |
| Tax effects of different tax rates in other countries | –47 | 15 | >100.0 |
| Current and deferred taxes relating to prior reporting periods | 147 | 56 | >100.0 |
| Change in deferred tax assets due to valuation adjustments | –28 | 17 | >100.0 |
| Other tax effects | –324 | –227 | 42.7 |
| Total | –2,410 | –2,820 | –14.5 |
The table shows a reconciliation from notional income taxes to recognized income taxes based on application of the current tax law in Germany.
D Balance sheet disclosures
| 15. Cash and cash equivalents | Dec. 31, 2016 € million | Dec. 31, 2015 € million | Change (percent) |
|---|---|---|---|
| Cash on hand | 7,047 | 6,364 | 10.7 |
| Balances with central banks and other government institutions | 18,374 | 14,171 | 29.7 |
| of which: with Deutsche Bundesbank | 13,279 | 10,921 | 21.6 |
| Public-sect or debt instruments and bills of exchange eligible for refinancing by central banks | – | 1 | –100.0 |
| Total | 25,421 | 20,536 | 23.8 |
| 16. Loans and advances to banks and customers | Dec. 31, 2016 € million | Dec. 31, 2015 € million | Change (percent) |
|---|---|---|---|
| Loans and advances to banks | 41,433 | 32,988 | 25.6 |
| Repayable on demand | 27,786 | 17,534 | 58.5 |
| Other loans and advances | 13,647 | 15,454 | –11.7 |
| Mortgage loans and other loans secured by mortgages on real estate | 61 | 19 | >100.0 |
| Local authority loans | 7,045 | 8,577 | –17.9 |
| Finance leases | 14 | 100 | –86.0 |
| Other loans and advances | 6,527 | 6,758 | –3.4 |
| Loans and advances to customers | 733,155 | 700,608 | 4.6 |
| Mortgage loans and other loans secured by mortgages on real estate | 284,637 | 272,199 | 4.6 |
| Local authority loans | 37,738 | 38,091 | –0.9 |
| Home savings loans advanced by building society | 37,253 | 33,659 | 10.7 |
| of which: from allotment( home savings loans) | 3,031 | 3,651 | –17.0 |
| for advance and interim financing | 32,219 | 27,905 | 15.5 |
| other building loans | 2,003 | 2,103 | –4.8 |
| Finance leases | 3,153 | 3,575 | –11.8 |
| Other loans and advances | 370,374 | 353,084 | 4.9 |
| 17. Allowances for losses on loans and advances | Specific loan loss allowance € million | Portfolio loan loss allowance € million | Total € million |
|---|---|---|---|
| Balance as at Jan. 1, 2015 | 7,454 | 1,065 | 8,519 |
| Additions | 2,027 | 116 | 2,143 |
| Utilizations | –984 | – | –984 |
| Reversals | –1,758 | –197 | –1,955 |
| Changes in the scope of consolidation | –14 | – | –14 |
| Other changes | –86 | 8 | –78 |
| Balance as at Dec. 31, 2015 | 6,639 | 992 | 7,631 |
| Additions | 2,103 | 234 | 2,337 |
| Utilizations | –702 | –1 | –703 |
| Reversals | –1,546 | –218 | –1,764 |
| Changes in the scope of consolidation | 14 | –28 | –14 |
| Other changes | 22 | 11 | 33 |
| Balance as at Dec. 31, 2016 | 6,530 | 990 | 7,520 |
| 18. Derivatives used for hedging (positive and negative fair values) | Dec. 31, 2016 € million | Dec. 31, 2015 € million | Change (percent) |
|---|---|---|---|
| Derivatives used for hedging (positive fair values) | 1,549 | 1,050 | 47.5 |
| for fair value hedges | 1,545 | 1,049 | 47.3 |
| for cash flow hedges | 2 | 1 | 100.0 |
| for hedges of net investments in foreign operations | 2 | – | – |
| Derivatives used for hedging (negative fair values) | 12,956 | 9,453 | 37.1 |
| for fair value hedges | 12,940 | 9,442 | 37.0 |
| for cash flow hedges | 16 | 10 | 60.0 |
| for hedges of net investments in foreign operations | – | 1 | –100.0 |
| 19. Financial assets held for trading | Dec. 31, 2016 € million | Dec. 31, 2015 € million | Change (percent) |
|---|---|---|---|
| Derivatives (positive fair values) | 23,587 | 24,665 | –4.4 |
| Interest-linked contracts | 20,440 | 22,221 | –8.0 |
| Currency-linked contracts | 1,794 | 1,253 | 43.2 |
| Share- and index-linked contracts | 298 | 320 | –6.9 |
| Credit derivatives | 244 | 287 | –15.0 |
| Other contracts | 811 | 584 | 38.9 |
| Securities | 10,378 | 14,424 | –28.1 |
| Bonds and other fixed-income securities | 9,321 | 13,387 | –30.4 |
| Shares and other variable-yield securities | 1,057 | 1,037 | 1.9 |
| Loans and advances | 13,963 | 14,117 | –1.1 |
| Inventories and trade receivables | 342 | 364 | –6.0 |
| Total | 48,270 | 53,570 | –9.9 |
| 20. Investments | Dec. 31, 2016 € million | Dec. 31, 2015 € million | Change (percent) |
|---|---|---|---|
| Securities | 248,491 | 246,591 | 0.8 |
| Bonds and other fixed-income securities | 191,003 | 193,932 | –1.5 |
| Shares and other variable-yield securities | 57,488 | 52,659 | 9.2 |
| Investments in subsidiaries | 1,265 | 1,315 | –3.8 |
| Equity investments | 2,209 | 2,054 | 7.5 |
| Investments in joint ventures | 543 | 548 | –0.9 |
| Investments in associates | 355 | 413 | –14.0 |
| Other shareholdings | 1,311 | 1,093 | 19.9 |
| Total | 251,965 | 249,960 | 0.8 |
| 21. Investments held by insurance companies | Dec. 31, 2016 € million | Dec. 31, 2015 € million | Change (percent) |
|---|---|---|---|
| Investment property | 2,470 | 2,251 | 9.7 |
| Investments in subsidiaries, joint ventures and associates | 621 | 527 | 17.8 |
| Mortgage loans | 9,049 | 8,732 | 3.6 |
| Promissory notes and loans | 7,667 | 8,001 | –4.2 |
| Registered bonds | 9,102 | 9,438 | –3.6 |
| Other loans | 768 | 837 | –8.2 |
| Variable-yield securities | 8,430 | 7,288 | 15.7 |
| Fixed-income securities | 40,769 | 36,598 | 11.4 |
| Derivatives (positive fair values) | 360 | 233 | 54.5 |
| Deposits with ceding insurers | 188 | 163 | 15.3 |
| Assets related to unit-linked contracts | 10,011 | 8,698 | 15.1 |
| Total | 89,435 | 82,766 | 8.1 |
| 22. Property, plant and equipment, and investment property | Dec. 31, 2016 € million | Dec. 31, 2015 € million | Change (percent) |
|---|---|---|---|
| Land and buildings | 6,839 | 6,839 | – |
| Office furniture and equipment | 1,378 | 1,408 | –2.1 |
| Assets subject to operating leases | 388 | 460 | –15.7 |
| Investment Property | 253 | 264 | –4.2 |
| Other fixed assets | 2,527 | 2,197 | 15.0 |
| Total | 11,385 | 11,168 | 1.9 |
| 23. Income tax assets and liabilities | Dec. 31, 2016 € million | Dec. 31, 2015 € million | Change (percent) |
|---|---|---|---|
| Income tax assets | 3,480 | 3,772 | –7.7 |
| Current income tax assets | 1,306 | 1,620 | –19.4 |
| Deferred tax assets | 2,174 | 2,152 | 1.0 |
| Income tax liabilities | 1,056 | 1,263 | –16.4 |
| Current income tax liabilities | 731 | 899 | –18.7 |
| Deferred tax liabilities | 325 | 364 | –10.7 |
| Deferred tax assets Dec. 31, 2016 € million | Deferred tax assets Dec. 31, 2015 € million | Deferred tax liabilities Dec. 31, 2016 € million | Deferred tax liabilities Dec. 31, 2015 € million | |
|---|---|---|---|---|
| Tax loss carryforwards | 59 | 35 | ||
| Loans and advances to banks and customers(net) | 82 | 91 | 203 | 520 |
| Financial assets and liabilities held for trading, derivatives used for hedging (positive and negative fair values) | 787 | 1,199 | 29 | 28 |
| Investments | 328 | 360 | 549 | 1,080 |
| Investments held by insurance companies | 147 | 26 | 589 | 449 |
| Deposits from banks and customers | 485 | 796 | 169 | 160 |
| Debt certificates including bonds | 119 | 111 | 11 | 14 |
| Provisions | 1,941 | 1,737 | 183 | 43 |
| Insurance liabilities | 73 | 118 | 395 | 287 |
| Intangible assets | – | – | 24 | 29 |
| Other balance sheet items | 102 | 132 | 122 | 207 |
| Total (gross) | 4,123 | 4,605 | 2,274 | 2,817 |
| Netting of deferred tax assets and deferred tax liabilities | –1,949 | –2,453 | –1,949 | –2,453 |
| Total (net) | 2,174 | 2,152 | 325 | 364 |
Deferred tax assets and liabilities are recognized for temporary differences in respect of the balance sheet items shown in the table as well as for tax loss carryforwards.
| 24. Other assets | Dec. 31, 2016 € million | Dec. 31, 2015 € million | Change (percent) |
|---|---|---|---|
| Other assets held by insurance companies | 3,719 | 3,182 | 16.9 |
| Goodwill | 58 | 59 | –1.7 |
| Other intangible assets | 423 | 350 | 20.9 |
| Prepaid expenses | 170 | 202 | –15.8 |
| Other receivables | 3,115 | 2,803 | 11.1 |
| Non-current assets and disposal groups classified as held for sale | 182 | 198 | –8.1 |
| Fair value changes of the hedged items in portfolio hedges of interest-rate risk | 9,098 | 6,512 | 39.7 |
| Residual other assets | 442 | 426 | 3.8 |
| Total | 17,207 | 13,732 | 25.3 |
The breakdown of other assets held by insurance companies is as follows:
| Dec. 31, 2016 € million | Dec. 31, 2015 € million | Change (percent) | |
|---|---|---|---|
| Intangible assets | 156 | 155 | 0.6 |
| Reinsurers’ share of insurance liabilities | 224 | 208 | 7.7 |
| Provision for unearned premiums | 6 | 8 | –25.0 |
| Benefit reserves | 63 | 65 | –3.1 |
| Provisions for claims outstanding | 155 | 135 | 14.8 |
| Loans and advances | 633 | 661 | –4.2 |
| Receivables arising out of direct insurance operations | 362 | 419 | –13.6 |
| Receivables arising out of reinsurance operations | 203 | 182 | 11.5 |
| Other receivables | 68 | 60 | 13.3 |
| Credit balances with banks, checks and cash on hand | 738 | 241 | >100.0 |
| Residual other assets | 1,968 | 1,917 | 2.7 |
| Property, plant and equipment | 418 | 437 | –4.3 |
| Prepaid expenses | 23 | 34 | –32.4 |
| Remaining assets held by insurance companies | 1,527 | 1,446 | 5.6 |
| Total | 3,719 | 3,182 | 16.9 |
| 25. Deposits from banks and customers | Dec. 31, 2016 € million | Dec. 31, 2015 € million | Change (percent) |
|---|---|---|---|
| Deposits from banks | 103,282 | 99,505 | 3.8 |
| Repayable on demand | 6,156 | 7,223 | –14.8 |
| With agreed maturity or notice period | 97,126 | 92,282 | 5.2 |
| Deposits from customers | 774,302 | 739,218 | 4.7 |
| Savings deposits and home savings deposits | 240,802 | 238,345 | 1.0 |
| Savings deposits with agreed notice period of three months | 174,621 | 172,203 | 1.4 |
| Savings deposits with agreed notice period of more than three months | 12,411 | 15,216 | –18.4 |
| Home savings deposits | 53,770 | 50,926 | 5.6 |
| Other deposits from customers | 533,500 | 500,873 | 6.5 |
| Repayable on demand | 417,210 | 379,985 | 9.8 |
| With agreed maturity or notice period | 116,290 | 120,888 | –3.8 |
| 26. Debt certificates issued including bonds | Dec. 31, 2016 € million | Dec. 31, 2015 € million | Change (percent) |
|---|---|---|---|
| Bonds issued | 44,813 | 48,489 | –7.6 |
| Mortgage Pfandbriefe | 27,299 | 26,385 | 3.2 |
| Public-sector Pfandbriefe | 5,058 | 8,383 | –39.7 |
| Other bonds | 12,526 | 13,721 | –8.7 |
| Other debt certificates issued | 26,309 | 21,759 | 20.9 |
| Total | 71,122 | 70,248 | 1.2 |
| 27. Financial liabilities held for trading | Dec. 31, 2016 € million | Dec. 31, 2015 € million | Change (percent) |
|---|---|---|---|
| Derivatives (negative fair values) | 25,123 | 27,822 | –9.7 |
| Interest-linked contracts | 19,568 | 22,328 | –12.4 |
| Currency-linked contracts | 1,171 | 1,259 | –7.0 |
| Share-and index-linked contracts | 791 | 799 | –1.0 |
| Credit derivatives | 101 | 166 | –39.2 |
| Other contracts | 3,492 | 3,270 | 6.8 |
| Short positions | 508 | 849 | –40.2 |
| Bonds issued and other debt certificates | 12,905 | 10,815 | 19.3 |
| Liabilities | 5,558 | 5,867 | –5.3 |
| Liabilities from commodities transactions and commodity lending | 45 | 44 | 2.3 |
| Total | 44,139 | 45,397 | –2.8 |
| 28. Provisions | Dec. 31, 2016 € million | Dec. 31, 2015 € million | Change (percent) |
|---|---|---|---|
| Provisions for defined benefit plans | 8,225 | 8,186 | 0.5 |
| Provisions for loans and advances | 456 | 418 | 9.1 |
| Provisions relating to building society operations | 915 | 653 | 40.1 |
| Residual provisions | 3,513 | 3,306 | 6.3 |
| Total | 13,109 | 12,563 | 4.3 |
| Funding status of defined benefit obligations | Dec. 31, 2016 € million | Dec. 31, 2015 € million | Change (percent) |
|---|---|---|---|
| Present value of defined benefit obligations not funded by plan assets | 7,064 | 7,684 | –8.1 |
| Present value of defined benefit obligations funded by plan assets | 2,400 | 1,703 | 40.9 |
| Present value of defined benefit obligations | 9,464 | 9,387 | 0.8 |
| less fair value of plan assets | –1,239 | –1,201 | 3.2 |
| Defined benefit obligations (net) | 8,225 | 8,186 | 0.5 |
| Provisions for defined benefit plans | 8,225 | 8,186 | 0.5 |
| Changes in the present value of defined benefit obligations | 2016 € million | 2015 € million | Change (percent) |
|---|---|---|---|
| Present value of defined benefit obligations as at Jan. 1 | 9,387 | 10,303 | –8.9 |
| Current service cost | 133 | 149 | –10.7 |
| Interest expense | 206 | 206 | – |
| Pension benefits paid including plan settlements | –330 | –374 | –11.8 |
| Past service cost | 6 | –9 | >100.0 |
| Actuarial gains (-) / losses (+) | 51 | –911 | >100.0 |
| Other changes | 11 | 23 | –52.2 |
| Present value of defined benefit obligations as at Dec. 31 | 9,464 | 9,387 | 0.8 |
| Changes in plan assets | 2016 € million | 2015 € million | Change (percent) |
|---|---|---|---|
| Fair value of plan assets as at Jan. 1 | 1,201 | 1,215 | –1.2 |
| Interest income | 26 | 24 | 8.3 |
| Contributions to plan assets | 43 | 26 | 65.4 |
| Pension benefits paid | –62 | –56 | 10.7 |
| Return on plan assets (excluding interest income) | 35 | –21 | >100.0 |
| Other changes | –4 | 13 | >100.0 |
| Fair value of plan assets as at Dec. 31 | 1,239 | 1,201 | 3.2 |
| Actuarial assumptions used for defined benefit obligations | Dec. 31, 2016 (percent) | Dec. 31, 2015 (percent) |
|---|---|---|
| Weighted discount rate | 1.75 | 2.24 |
| Weighted salary increase | 1.83 | 1.89 |
| Weighted pension increase | 1.75 | 1.76 |
| 29. Insurance liabilities | Dec. 31, 2016 € million | Dec. 31, 2015 € million | Change (percent) |
|---|---|---|---|
| Provision for unearned premiums | 1,119 | 1,104 | 1.4 |
| Benefit reserve | 55,167 | 52,634 | 4.8 |
| Provision for claims outstanding | 10,071 | 9,257 | 8.8 |
| Provision for premium refunds | 8,918 | 7,923 | 12.6 |
| Other insurance liabilities | 65 | 53 | 22.6 |
| Reserve for unit-linked insurance contracts | 8,785 | 7,958 | 10.4 |
| Total | 84,125 | 78,929 | 6.6 |
| Change in provision for unearned premiums | 2016 € million | 2015 € million | Change (percent) |
|---|---|---|---|
| Balance as at Jan. 1 | 1,104 | 1,071 | 3.1 |
| Additions | 1,180 | 1,170 | 0.9 |
| Utilizations / reversals | –1,172 | –1,143 | –2.5 |
| Changes attributable to currency translation | 7 | 6 | 16.7 |
| Balance as at Dec. 31 | 1,119 | 1,104 | 1.4 |
| Change in benefit reserve | 2016 € million | 2015 € million | Change (percent) |
|---|---|---|---|
| Balance as at Jan. 1 | 52,634 | 49,724 | 5.9 |
| Additions | 6,158 | 5,965 | 3.2 |
| Interest component | 1,128 | 1,392 | –19.0 |
| Utilizations / reversals | –4,753 | –4,448 | –6.9 |
| Changes attributable to currency translation | – | 1 | –100.0 |
| Balance as at Dec. 31 | 55,167 | 52,634 | 4.8 |
Supplementary change-in-discount-rate reserves totaling €2,162 million have been recognized for policies with a discount rate in excess of the reference rate specified in the DeckRV (December 31, 2015: €1,528 million).
| Change in the provision for claims outstanding | 2016 € million | 2015 € million | Change (percent) |
|---|---|---|---|
| Balance as at Jan. 1 | 9,257 | 8,352 | 10.8 |
| Claims expenses | 5,827 | 5,463 | 6.7 |
| Less payments | –4,983 | –4,622 | –7.8 |
| Changes attributable to currency translation | –30 | 64 | <–100.0 |
| Balance as at Dec. 31 | 10,071 | 9,257 | 8.8 |
| Change in the provision for premium refunds | 2016 € million | 2015 € million | Change (percent) |
|---|---|---|---|
| Balance as at Jan. 1 | 7,923 | 8,568 | –7.5 |
| Additions | 670 | 665 | 0.8 |
| Utilizations / reversals | –760 | –797 | 4.6 |
| Changes resulting from unrealized gains and losses on investments (through other comprehensive income) | 367 | –626 | >100.0 |
| Changes resulting from other remeasurements (through profit or loss) | 718 | 99 | >100.0 |
| Changes attributable to currency translation | – | 14 | –100.0 |
| Balance as at Dec. 31 | 8,918 | 7,923 | 12.6 |
The breakdown of maturities for insurance liabilities is shown in the following tables:
| ≤ 1 year € million | > 1 year – 5 years € million | > 5 years € million | Indefinite € million | |
|---|---|---|---|---|
| Balance as at December 31, 2016 | ||||
| Provision for unearned premiums | 1,011 | 83 | 25 | – |
| Benefit reserve | 1,654 | 6,983 | 12,129 | 34,401 |
| Provision for claims outstanding | 4,297 | 3,273 | 2,501 | – |
| Provision for premium refunds | 701 | 646 | 754 | 6,817 |
| Other insurance liabilities | 43 | 15 | 3 | 4 |
| Total | 7,706 | 11,000 | 15,412 | 41,222 |
| Balance as at December 31, 2015 | ||||
| Provision for unearned premiums | 982 | 100 | 22 | – |
| Benefit reserve | 1,977 | 6,658 | 12,292 | 31,707 |
| Provision for claims outstanding | 3,855 | 3,090 | 2,312 | – |
| Provision for premium refunds | 739 | 607 | 854 | 5,723 |
| Other insurance liabilities | 39 | 9 | 3 | 2 |
| Total | 7,592 | 10,464 | 15,483 | 37,432 |
| 30. Other liabilities | Dec. 31, 2016 € million | Dec. 31, 2015 € million | Change (percent) |
|---|---|---|---|
| Other liabilities of insurance companies | 4,948 | 4,255 | 16.3 |
| Other liabilities and accruals | 2,150 | 2,256 | –4.7 |
| Liabilities included in disposal groups | 25 | 7 | >100.0 |
| Fair value changes of the hedged items in portfolio hedges of interest-rate risk | 431 | 479 | –10.0 |
| Residual other liabilities | 586 | 572 | 2.4 |
| Total | 8,140 | 7,569 | 7.5 |
The breakdown of other liabilities of insurance companies is as follows:
| Dec. 31, 2016 € million | Dec. 31, 2015 € million | Change (percent) | |
|---|---|---|---|
| Residual provisions | 329 | 327 | 0.6 |
| Provisions for employee benefits | 303 | 297 | 2.0 |
| Provisions for share-based payment transactions | 1 | 1 | – |
| Other provisions | 25 | 29 | –13.8 |
| Payables and residual other liabilities | 4,619 | 3,928 | 17.6 |
| Subordinated capital | 76 | 73 | 4.1 |
| Deposits received from reinsurers | 85 | 78 | 9.0 |
| Payables arising out of direct insurance operations | 1,523 | 1,574 | –3.2 |
| Payables arising out of reinsurance operations | 239 | 230 | 3.9 |
| Debt certificates issued including bonds | 30 | 29 | 3.4 |
| Deposits from banks | 613 | 524 | 17.0 |
| Derivatives (negative fair values) | 105 | 70 | 50.0 |
| Liabilities from capitalization transactions | 1,345 | 775 | 73.5 |
| Other liabilities | 197 | 198 | –0.5 |
| Residual other liabilities | 406 | 377 | 7.7 |
| Total | 4,948 | 4,255 | 16.3 |
| 31. Subordinated capital | Dec. 31, 2016 € million | Dec. 31, 2015 € million | Change (percent) |
|---|---|---|---|
| Subordinated liabilities | 4,800 | 4,851 | –1.1 |
| Profit-sharing rights | 158 | 494 | –68.0 |
| Share capital repayable on demand | 22 | 22 | – |
| Total | 4,980 | 5,367 | –7.2 |
E Financial instruments disclosures
| 32. Fair value of financial instruments | Carrying amount Dec. 31, 2016 € million | Fair value Dec. 31, 2016 € million | Carrying amount Dec. 31, 2015 € million | Fair value Dec. 31, 2015 € million |
|---|---|---|---|---|
| Assets | ||||
| Cash and cash equivalents | 18,374 | 18,374 | 14,172 | 14,172 |
| Loans and advances to banks1 | 41,397 | 43,366 | 32,935 | 34,931 |
| Loans and advances to customers1 | 725,671 | 728,364 | 693,030 | 699,519 |
| Derivatives used for hedging (positive fair values) | 1,549 | 1,549 | 1,050 | 1,050 |
| Financial assets held for trading2 | 47,928 | 47,928 | 53,206 | 53,206 |
| Investments3 | 251,067 | 251,142 | 248,999 | 249,204 |
| Investments held by insurance companies2,3 | 76,749 | 77,787 | 71,614 | 72,688 |
| Other assets2 | 13,018 | 13,042 | 9,645 | 9,074 |
| Liabilities | ||||
| Deposits from banks | 103,282 | 105,325 | 99,505 | 101,724 |
| Deposits from customers | 774,302 | 776,260 | 739,218 | 743,352 |
| Debt certificates issued including bonds | 71,122 | 70,626 | 70,248 | 70,955 |
| Derivatives used for hedging (negative fair values) | 12,956 | 12,956 | 9,453 | 9,453 |
| Financial liabilities held for trading2 | 44,094 | 44,094 | 45,353 | 45,353 |
| Other liabilities2 | 2,810 | 2,630 | 2,882 | 2,408 |
| Subordinated capital | 4,980 | 5,717 | 5,367 | 5,633 |
1 Carrying amounts less loan loss allowances
2 Fair values and carrying amounts are only disclosed for financial instruments
3 Excluding investments in joint ventures and in associates
The above table shows the disclosures on the fair value of financial instruments included in the published annual reports of the DZ BANK Group and, in the previous year, the WGZ BANK Group. For all other companies included in the consolidated financial statements, the fair value was deemed to be equivalent to the carrying amount.
| 33. Maturity analysis | ≤ 3 months € million | > 3months – 1 year € million | > 1 year € million | Indefinite € million |
|---|---|---|---|---|
| Balance as at December 31, 2016 | ||||
| Loans and advances to banks | 19,512 | 3,272 | 23,076 | 501 |
| Loans and advances to customers | 37,800 | 56,874 | 636,339 | 19,599 |
| Deposits from banks | 27,553 | 8,148 | 69,347 | 962 |
| Deposits from customers | 627,400 | 24,076 | 73,794 | 54,042 |
| Debt certificates issued including bonds | 14,569 | 12,811 | 45,521 | – |
| Balance as at December 31, 2015 | ||||
| Loans and advances to banks | 14,574 | 3,296 | 20,617 | 413 |
| Loans and advances to customers | 39,645 | 56,021 | 602,025 | 19,987 |
| Deposits from banks | 30,207 | 8,867 | 62,828 | 349 |
| Deposits from customers | 589,240 | 27,995 | 76,732 | 51,192 |
| Debt certificates issued including bonds | 15,462 | 11,187 | 45,960 | – |
The contractual maturities shown in the above table do not match the estimated actual cash inflows and cash outflows.
F Other disclosures
| 34. Capital requirements and regulatory indicators | Dec. 31, 2016 € million | Dec. 31, 2015 € million | Change (percent) |
|---|---|---|---|
| Total capital | 92,134 | 87,628 | 5.1 |
| Tier 1 capital | 75,006 | 69,174 | 8.4 |
| of which: Common Equity Tier 1 | 74,170 | 68,233 | 8.7 |
| Additional Tier 1 capital | 836 | 941 | –11.2 |
| Tier 2 capital | 17,128 | 18,454 | –7.2 |
| Total risk exposure | 572,458 | 555,952 | 3.0 |
| Common Equity Tier 1 capital ratio (percent) | 13.0 | 12.3 | |
| Tier 1 capital ratio (percent) | 13.1 | 12.4 | |
| Total capital ratio (percent) | 16.1 | 15.8 | |
| Common Equity Tier 1 capital ratio incl. reserves pursuant to Section 340f HGB (for information, percent)1 | 15.2 | 14.6 | |
| Tier 1 capital ratio incl. reserves pursuant to Section 340f HGB (for information, percent)1 | 15.4 | 14.8 | |
| Leverage ratio (for information, percent)2 | 6.3 | 6.0 | |
| Leverage ratio incl. reserves pursuant to Section 340f HGB (for information, percent)3 | 7.3 | 6.9 |
1 The balance of reserves pursuant to Section 340f HGB is based on the financial statements data reported for regulatory purposes before additions and reversals within the scope of the 2016 and 2015 financial statements.
2 Disclosure of the leverage ratio of the bank-specific protection system using the transitional definition for Tier 1 capital.
3 Disclosure of ratio after full introduction of the new CRR provisions (fully loaded), subject to the assumption of full reclassification and inclusion of reserves pursuant to Section 340f HGB as Tier 1 capital from a business point of view.
| 35. Financial guarantee contracts and loan commitments | Dec. 31, 2016 € million | Dec. 31, 2015 € million | Change (percent) |
|---|---|---|---|
| Financial guarantee contracts | 18,259 | 18,024 | 1.3 |
| Loan commitments | 71,528 | 65,965 | 8.4 |
| Total | 89,787 | 83,989 | 6.9 |
The amounts shown for financial guarantee contracts and loan commitments are the nominal values of the respective exposure.
| 36. Trust activities | Dec. 31, 2016 € million | Dec. 31, 2015 € million | Change (percent) |
|---|---|---|---|
| Trust assets | 1,592 | 2,692 | –40.9 |
| of which: trust loans | 595 | 1,679 | –64.6 |
| Trust liabilities | 1,592 | 2,692 | –40.9 |
| of which: trust loans | 595 | 1,679 | –64.6 |
| 37. Asset management by the Union Investment Group | Dec. 31, 2016 € million | Dec. 31, 2015 € million | Change (percent) |
|---|---|---|---|
| Fund assets | 258,956 | 230,685 | 12.3 |
| Other types of asset management | 44,839 | 40,714 | 10.1 |
| Unit-linked asset management | 909 | 696 | 30.6 |
| Institutional asset management | 10,951 | 10,342 | 5.9 |
| Advisory and outsourcing | 32,979 | 29,676 | 11.1 |
| Accounts managed by third parties | –11,523 | –10,597 | 8.7 |
| Total | 292,272 | 260,802 | 12.1 |
As at the balance sheet date, the Union Investment Group (through Union Asset Management Holding AG) had total assets under management of €292,272 million (December 31, 2015: €260,802 million). The fund assets comprise equity funds, fixed-income funds, money market funds, mixed funds, other securities funds, capital preservation funds, real estate funds, alternative investment funds and hybrid funds issued by Union Investment Group.
In addition, Union Investment Group has assets under management within the scope of institutional asset management, unit-linked asset management, and advisory and outsourcing. The fund volume of funds that have been issued by Union Investment Group but whose portfolio management has been outsourced is shown as a deduction. The definition of assets under management is based on the aggregate statistics from the Federal Association of German Fund Management Companies (BVI), Frankfurt/Main.
| 38. Leases Finance leases with the Cooperative Financial Network as lessor | Dec. 31, 2016 € million | Dec. 31, 2015 € million | Change (percent) |
|---|---|---|---|
| Gross investment | 3,498 | 4,025 | –13.1 |
| Up to 1 year | 1,111 | 1,188 | –6.5 |
| More than 1 year and up to 5 years | 2,072 | 2,337 | –11.3 |
| More than 5 years | 315 | 500 | –37.0 |
| less unearned finance income | –328 | –397 | –17.4 |
| Net investment | 3,170 | 3,628 | –12.6 |
| less present value of unguaranteed residual values | –70 | –90 | –22.2 |
| Present value of minimum lease payment receivables | 3,100 | 3,538 | –12.4 |
| Up to 1 year | 971 | 1,038 | –6.5 |
| More than 1 year and up to 5 years | 1,853 | 2,071 | –10.5 |
| More than 5 years | 276 | 429 | –35.7 |
As at the balance sheet date, the accumulated allowance for uncollectable minimum lease payments at lessor companies amounted to €32 million (December 31, 2015: €41 million).
The DVB Bank Group and the VR LEASING Group are active as finance lessors in the Cooperative Financial Network. The entities in the DVB Bank Group primarily enter into leases for ships, ship containers, and aircraft. Entities in the VR LEASING Group mainly enter into equipment leases with their customers.
| 39. Changes in the contract portfolios held by Bausparkasse Schwäbisch Hall | Not allocated Number of contracts | Not allocated Home savings sum € million | Allocated Number of contracts | Allocated Home savings sum € million | Total Number of contracts | Total Home savings sum € million |
|---|---|---|---|---|---|---|
| Balance as at Dec. 31, 2015 | 7,704,599 | 263,769 | 827,806 | 22,375 | 8,532,405 | 286,144 |
| Additions in 2016 as a result of | ||||||
| New contracts (redeemed contracts)1 | 656,465 | 28,171 | – | – | 656,465 | 28,171 |
| Transfers | 23,471 | 660 | 951 | 22 | 24,422 | 682 |
| Allocation waivers and cancellations | 9,411 | 414 | – | – | 9,411 | 414 |
| Splitting | 220,051 | – | 63 | – | 220,114 | – |
| Allocations and acceptance of allocations | – | – | 356,533 | 9,398 | 356,533 | 9,398 |
| Other | 84,399 | 2,865 | 25 | 1 | 84,424 | 2,866 |
| Total | 993,797 | 32,110 | 357,572 | 9,421 | 1,351,369 | 41,531 |
| Disposals in 2016 as a result of | ||||||
| Allocations and acceptance of allocations | –356,533 | –9,398 | – | – | –356,533 | –9,398 |
| Reductions | – | –899 | – | – | – | –899 |
| Termination | –345,920 | –8,460 | –277,482 | –7,110 | –623,402 | –15,570 |
| Transfers | –23,471 | –660 | –951 | –22 | –24,422 | –682 |
| Pooling1 | –57,939 | – | –1 | – | –57,940 | – |
| Expiration | – | – | –155,187 | –4,073 | –155,187 | –4,073 |
| Allocation waivers and cancellations | – | – | –9,411 | –414 | –9,411 | –414 |
| Other | –84,399 | –2,865 | –25 | –1 | –84,424 | –2,866 |
| Total | –868,262 | –22,282 | –443,057 | –11,620 | –1,311,319 | –33,902 |
| Net addition/disposal | 125,535 | 9,828 | –85,485 | –2,199 | 40,050 | 7,629 |
| Balance as at Dec. 31, 2016 | 7,830,134 | 273,597 | 742,321 | 20,176 | 8,572,455 | 293,773 |
1 Including increases
| Volume of unredeemed contracts | Number of contracts | Home savings sum € million |
|---|---|---|
| Contracts signed prior to Jan. 1, 2016 | 62,451 | 2,615 |
| Contracts signed in 2016 | 197,805 | 11,074 |
| 40. Changes in the allocation assets of Bausparkasse Schwäbisch Hall | 2016 € million |
|---|---|
| Additions | |
| Amounts carried forward from 2015 (surplus) | |
| Amounts not yet disbursed | 48,783 |
| Additions in 2016 | |
| Savings deposits (including credited residential construction bonuses) | 9,206 |
| Repayable amounts (including credited residential construction bonuses)1 | 1,628 |
| Interest on home savings deposits | 706 |
| Total | 60,323 |
| Withdrawals | |
| Withdrawals in 2016 | |
| Amounts allocated (if disbursed) | |
| Home savings deposits | 5,277 |
| Building loans | 993 |
| Repayment of deposits on non-allocated home savings contracts | 1,445 |
| Building society guarantee fund | 350 |
| Surplus of additions | |
| (Amounts not yet disbursed) at the end of 20162 | 52,258 |
| Total | 60,323 |
1 Amounts repaid are the portion of the loan principal actually repaid.
2 The surplus amounts allocated include:
a undisbursed home savings deposits from allocated home savings contracts: €97 million
b undisbursed home savings loans from funds allocated: €4,191 million
| 41. Cover statement for the mortgages and local authority loans extended by the mortgage banks | Mortgage Pfandbriefe Dec. 31, 2016 € million | Mortgage Pfandbriefe Dec. 31, 2015 € million | Mortgage Pfandbriefe Change (percent) | Public-sector Pfandbriefe Dec. 31, 2016 € million | Public-sector Pfandbriefe Dec. 31, 2015 € million | Public-sector Pfandbriefe Change (percent) |
|---|---|---|---|---|---|---|
| Ordinary cover | 51,148 | 47,484 | 7.7 | 26,319 | 31,131 | –15.5 |
| Loans and advances to banks | 33 | 37 | –10.8 | 741 | 1,048 | –29.3 |
| of which: Mortgage loans | 33 | 37 | –10.8 | – | – | – |
| Local authority loans | – | – | – | 741 | 1,048 | –29.3 |
| Loans and advances to customers | 50,969 | 47,300 | 7.8 | 20,934 | 22,945 | –8.8 |
| of which: Mortgage loans | 50,969 | 47,300 | 7.8 | 74 | 84 | –11.9 |
| Local authority loans | – | – | – | 20,860 | 22,861 | –8.8 |
| Investments consisting of bonds and other fixed-income securities | – | – | – | 2,603 | 4,839 | –46.2 |
| Property, plant and equipment | 146 | 147 | –0.7 | 2,041 | 2,299 | –11.2 |
| Extended cover | 1,784 | 2,353 | –24.2 | 187 | 507 | –63.1 |
| Loans and advances to banks | – | 150 | –100.0 | 18 | 358 | –95.0 |
| Investments consisting of bonds and other fixed-income securities | 1,784 | 2,203 | –19.0 | 169 | 149 | 13.4 |
| Total cover | 52,932 | 49,837 | 6.2 | 26,506 | 31,638 | –16.2 |
| Pfandbriefe requiring cover | –46,344 | –44,558 | 4.0 | –23,275 | –28,250 | –17.6 |
| Nominal excess cover | 6,588 | 5,279 | 24.8 | 3,231 | 3,388 | –4.6 |
| Present value of excess cover | 10,199 | 8,839 | 15.4 | 3,938 | 4,316 | –8.8 |
| Risk-related present value of excess cover | 9,095 | 7,016 | 29.6 | 3,498 | 3,628 | –3.6 |
The present value of excess cover is higher than the nominal excess cover because it includes an interest component.
| Maturity structure of mortgage Pfandbriefe and public-sector Pfandbriefe in issue | Dec. 31, 2016 € million | Dec. 31, 2015 € million | Change (percent) |
|---|---|---|---|
| Mortgage Pfandbriefe | 46,344 | 44,558 | 4.0 |
| <= 6 months | 1,735 | 4,560 | –62.0 |
| > 6 months and <= 12 months | 1,937 | 1,305 | 48.4 |
| > 12 months and <= 18 months | 1,368 | 1,664 | –17.8 |
| > 18 months and <= 2 years | 1,981 | 1,886 | 5.0 |
| > 2 years and <= 3 years | 4,207 | 2,773 | 51.7 |
| > 3 years and <= 4 years | 3,574 | 3,671 | –2.6 |
| > 4 years and <= 5 years | 3,424 | 3,555 | –3.7 |
| > 5 years and <= 10 years | 16,131 | 13,818 | 16.7 |
| > 10 years | 11,987 | 11,326 | 5.8 |
| Public-sector Pfandbriefe | 23,275 | 28,250 | –17.6 |
| <= 6 months | 1,909 | 1,722 | 10.9 |
| > 6 months and <= 12 months | 1,112 | 3,479 | –68.0 |
| > 12 months and <= 18 months | 711 | 1,900 | –62.6 |
| > 18 months and <= 2 years | 1,950 | 1,129 | 72.7 |
| > 2 years and <= 3 years | 2,064 | 2,666 | –22.6 |
| > 3 years and <= 4 years | 2,209 | 2,129 | 3.8 |
| > 4 years and <= 5 years | 1,390 | 2,270 | –38.8 |
| > 5 years and <= 10 years | 5,234 | 5,910 | –11.4 |
| > 10 years | 6,696 | 7,045 | –5.0 |
| Fixed-interest periods of cover assets | Dec. 31, 2016 € million | Dec. 31, 2015 € million | Change (percent) |
|---|---|---|---|
| Mortgage Pfandbriefe | 52,932 | 49,837 | 6.2 |
| <= 6 months | 1,896 | 2,969 | –36.1 |
| > 6 months and <= 12 months | 2,978 | 2,540 | 17.2 |
| > 12 months and <= 18 months | 2,225 | 2,203 | 1.0 |
| > 18 months and <= 2 years | 2,624 | 2,725 | –3.7 |
| > 2 years and <= 3 years | 4,688 | 4,909 | –4.5 |
| > 3 years and <= 4 years | 4,695 | 4,497 | 4.4 |
| > 4 years and <= 5 years | 4,423 | 4,630 | –4.5 |
| > 5 years and <= 10 years | 19,331 | 17,525 | 10.3 |
| > 10 years | 10,072 | 7,839 | 28.5 |
| Public-sector Pfandbriefe | 26,506 | 31,638 | –16.2 |
| <= 6 months | 1,492 | 1,693 | –11.9 |
| > 6 months and <= 12 months | 1,575 | 2,175 | –27.6 |
| > 12 months and <= 18 months | 1,128 | 1,523 | –25.9 |
| > 18 months and <= 2 years | 916 | 2,181 | –58.0 |
| > 2 years and <= 3 years | 2,002 | 2,115 | –5.3 |
| > 3 years and <= 4 years | 1,780 | 2,008 | –11.4 |
| > 4 years and <= 5 years | 1,378 | 1,717 | –19.7 |
| > 5 years and <= 10 years | 6,443 | 6,530 | –1.3 |
| > 10 years | 9,792 | 11,696 | –16.3 |
124 properties (December 31, 2015: 150) were in forced administration as at the reporting date. The mortgage loans held as cover include past-due payments for interests to be paid in the amount of €1 million (December 31, 2015: €1 million).
42.
Board of Managing Directors of the National Association of German Cooperative Banks (BVR)
Uwe Fröhlich (President)
Gerhard P. Hofmann
Dr. Andreas Martin
Berlin, July 12, 2017
National Association of German Cooperative Banks (BVR)
BVR
Board of Managing Directors
Uwe Fröhlich Gerhard P. Hofmann Dr. Andreas Martin
Bundesverband der Deutschen
Volksbanken und Raiffeisenbanken -
BVR
Schellingstraße 4 - 10785 Berlin
Telefon 030 2021-0
Heussallee 5 - 53113 Bonn
Telefon 0228 509-0
follow us:
